Create a Chart in Excel
Links Verified: March 19, 2026
Creating a chart in Excel helps beginners turn worksheet data into a visual display that is easier to understand. Charts work best when the data is arranged clearly before you begin.
Click image for a larger view.
Before You Insert a Chart
Make sure your worksheet has clear headings and organized data. Good chart data usually has labels in one column and matching numbers in another.
Basic Steps
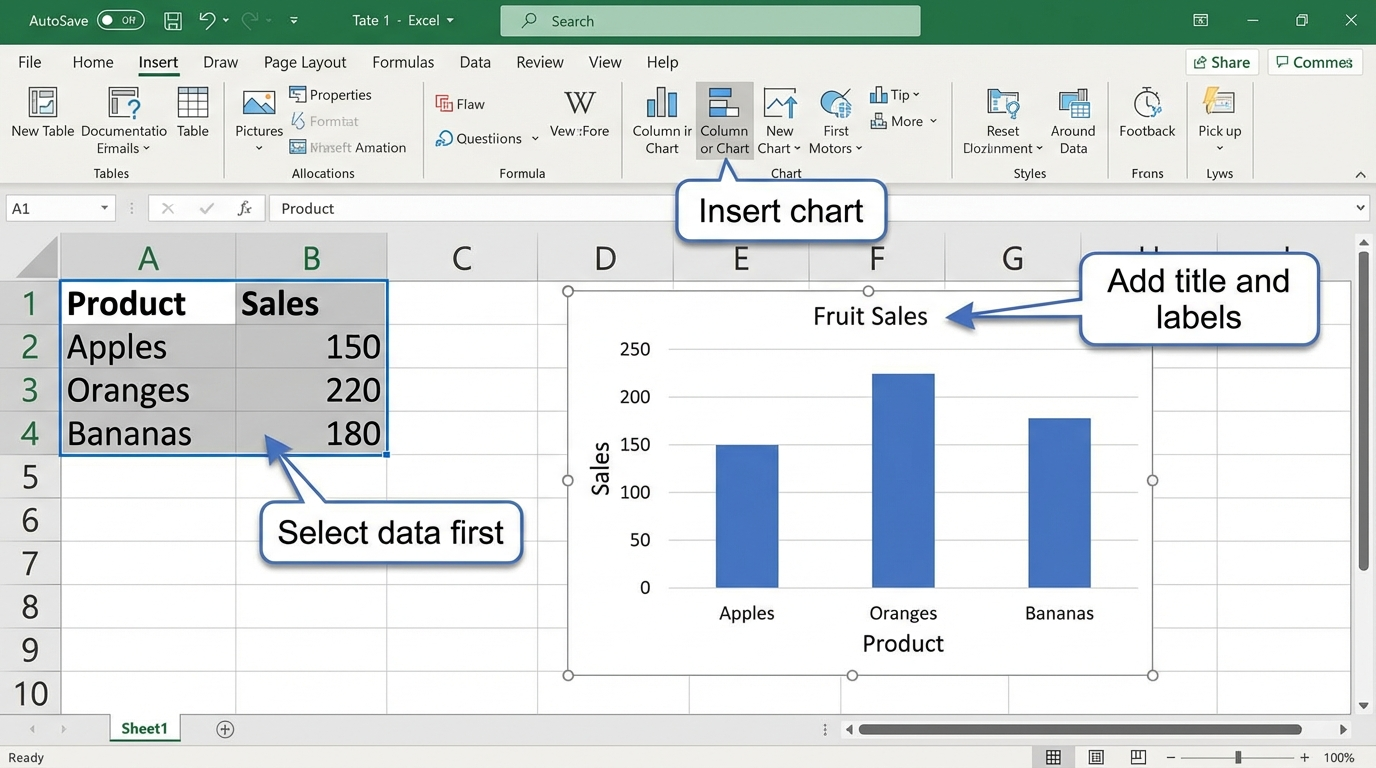
- Select the data you want to chart.
- Insert a chart.
- Choose a chart type such as a bar chart or column chart.
- Add a clear title.
Try It
Create a chart from a short classroom survey, reading log, or supply list total.
Next step: Continue to Excel Classroom Data Projects.
Internet4classrooms is a collaborative effort by
Susan Brooks and Bill Byles.