| Sign Up For Our Newsletter |
| Sign Up For Our Newsletter |

Using the Insert Tab in Excel 2007
Tip: If you are unsure what the function of a feature is, let your cursor hover over the button (in Excel) to see a pop-up box explaining the feature. If you want to collapse the ribbon so that none of the buttons are displayed, double-click the name of the tab.
Tables 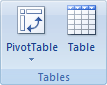
Pivot Table - Summarize data using a Pivot Table. Pivot Table makes it easy to arrange and summarize complicated data and drill down on details.
Table - Create a table to manage and analyze related data. Tables make it easy to sort, filter, and format data within a sheet. You can also use the keyboard shortcut Ctrl + T to create a table.
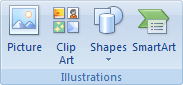
Picture - Insert a picture from a file.
Clip Art - Insert Clip Art into the document, including movies, sounds, or stock photography to illustrate a specific concept.
Shapes - Insert ready-made shapes, such as rectangles and circles, arrows, lines, flow chart symbols, and callouts.
SmartArt - Insert a Smart Art graphic to visually communicate information. Smart Art graphics range from graphical lists and process diagrams to more complex graphics, such as Venn diagrams and organization charts. Caution ! Using the SmartArt version of a Venn diagram does not make use of everything you may want to do with a Venn. For example, you can not type in the overlap area where you normally place shared characteristics of the things you are comparing. To make a true Venn you should use the circle tool in Shapes .
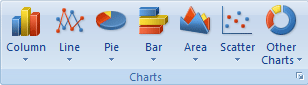
Column - Insert a column chart. Column charts are used to compare values across categories. If chart data is selected, or the cursor is in or adjacent to the data, pressing F11 automatically creates a column chart.
Line - Insert a line chart. Line charts are used to display trends over time.
Pie - Insert a pie chart. Pie charts display the contribution of each value to a total. Use a pie chart when values can be added together or when you have only one data series and all values are positive.
Bar - Insert a bar chart. Bar charts are the best chart type for comparing multiple values.
Area - Insert an are chart. Area charts emphasize differences between several sets of data over a period of time.
Scatter - Insert a Scatter chart, also known as an X Y chart. This type of chart compares pairs of values. Use a Scatter chart when the values being charted are not in X-axis order or when they represent separate measurements.
Other Charts - Insert a stock, surface, doughnut, bubble, or radar chart.
Diagonal Arrow - Click on the arrow in the bottom right corner of Charts to see the Insert Chart dialog box to see all of the available charts.

Hyperlink - Create a link to a Web page, a picture, an e-mail address or a program. You can also use the keyboard shortcut Ctrl + K to create a hyperlink.
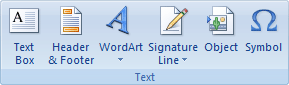
Text Box - Insert a text box that can be positioned anywhere on the page. In Office 2007 you can also create a text box by using the Paste as Picture feature when on the Home tab.
Header & Footer - Edit the Header or Footer of the document. The information in the Header or Footer will appear at the top or bottom of each printed page.
WordArt - Insert decorative text in your document. Caution : if you are a long-time user of Word Art you may be a bit disappointed in the 2007 version - the choices are a bit tame.
Signature Line - INsert a signature line that specifies the individual who must sign. Inserting a digital signature requires that you obtain a digital ID, such as one from a certified Microsoft partner.
Object - Insert an embedded object. Some objects supported are Adobe Acrobat documents, Photoshop Elements images, Microsoft Equation, and several others.
Symbol - Insert characters that are not on your keyboard, such as copyright symbols, trademark symbols, paragraph marks, and Unicode characters. This is way beyond Wingdings or Webdings. Even Times New Roman has a large number of symbols and foreign letter characters which can be inserted.
In the Table below, select which section of the Insert tab you would use to perform the stated action.
2. After you finished compiling a list of Internet addresses, you decided to make a decorative title in WordArt. Which area contains WordArt?
� � � � � �x
3. You want to make a Venn diagram to use on an interactive whiteboard as your students list shared and unique charasteristics of plants and animals. Which section will you use to do that?
� � � � � �x
4. To illustrate a concept in Algebra you want to make a scatter plot. Which section of the Insert tab will do that?
� � � � � �x
5. You want to use a greek character - pi, omega, sigma, or some other character - where can you find them?
� � � � � �x
6. You want to arrange and summarize complicated data. Which section of the Insert tab allows you to do that easily?
� � � � � �x
7. You want to put some information on the worksheet which will be printed, but you do not want the information to be in one of the cells of your worksheet. What area of the Insert tab will you use to do that?
� � � � � �x

Internet4classrooms is a collaborative effort by
Susan Brooks and Bill Byles.

advertisement
advertisement
Use of this Web site constitutes acceptance of our Terms of Service and Privacy Policy.