| Sign Up For Our Newsletter |
| Sign Up For Our Newsletter |
Interpret Graphs
Links verified on 04/08/2024
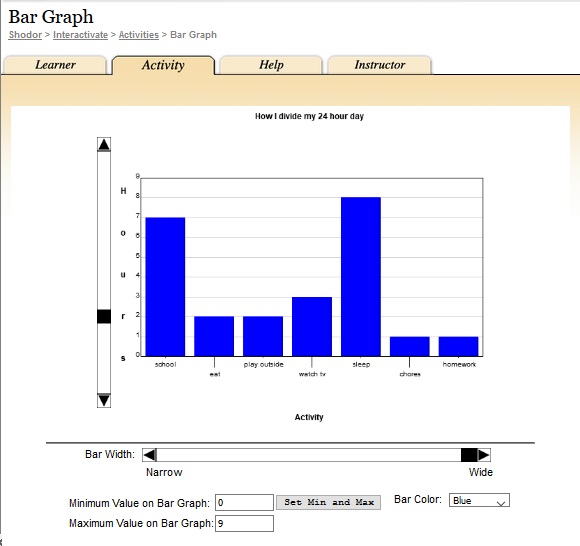
1. Bar Graph.
Click Image to Enlarge
Enter data to create a bar graph, then manipulate the graph's maximum and minimum values. SEE MORE
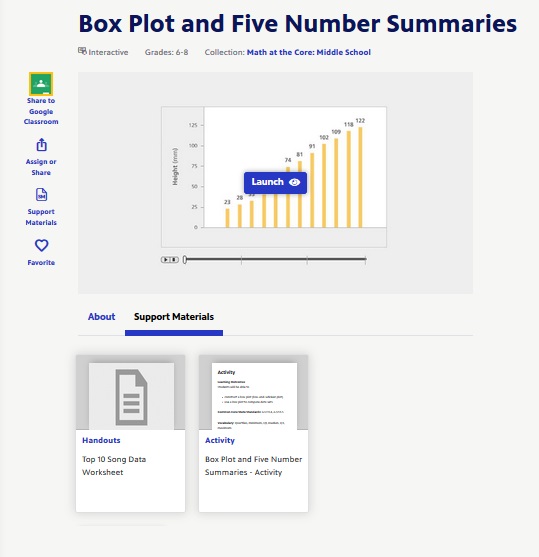
2. Box Plot and Five Number Summaries.
Click Image to Enlarge
Compare and contrast the appearance of the same data as it transitions from a bar graph to a box and whisker plot. This interactive illustration focuses on determining the max, min, median, and upper and lower quartiles of a set of data and provides the opportunity to visualize it in multiple ways. (Handout and printed directions SEE MORE
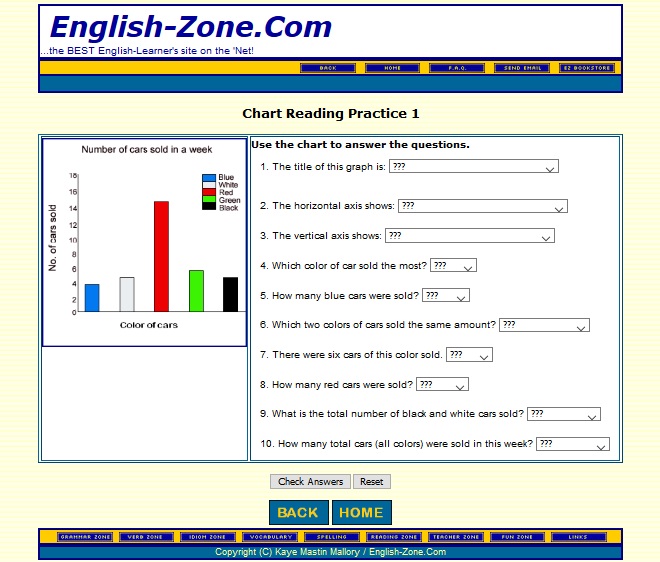
3. Chart Reading Practice.
Click Image to Enlarge
Use the chart to answer the 10 questions. SEE MORE
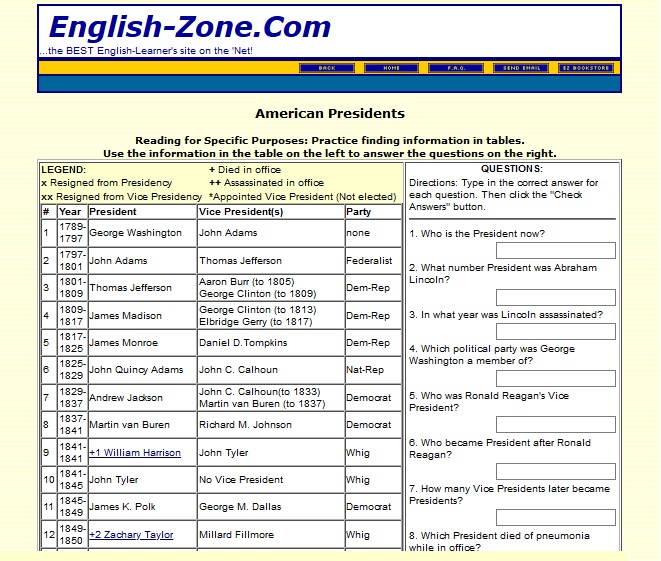
4. Chart Study: American Presidents.
Click Image to Enlarge
Practice finding information in tables and reading for specific purposes. Answer the questions on the right with the information from the table on the left. SEE MORE
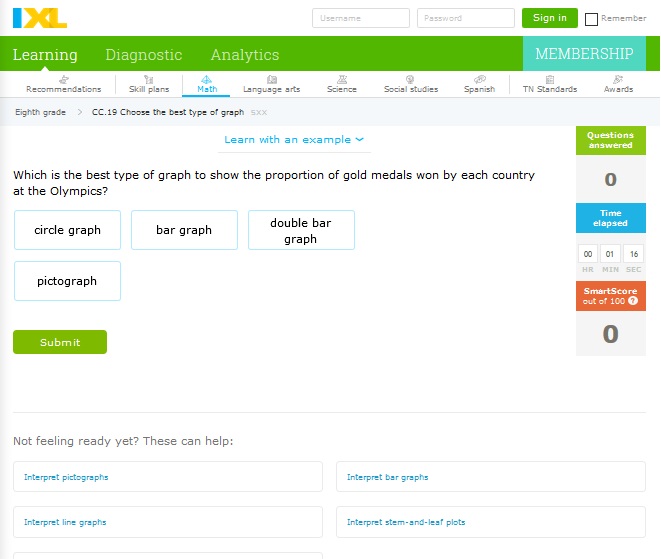
5. Choose the Best Type of Graph.
Click Image to Enlarge
Determine which graph should be used for each question. SEE MORE
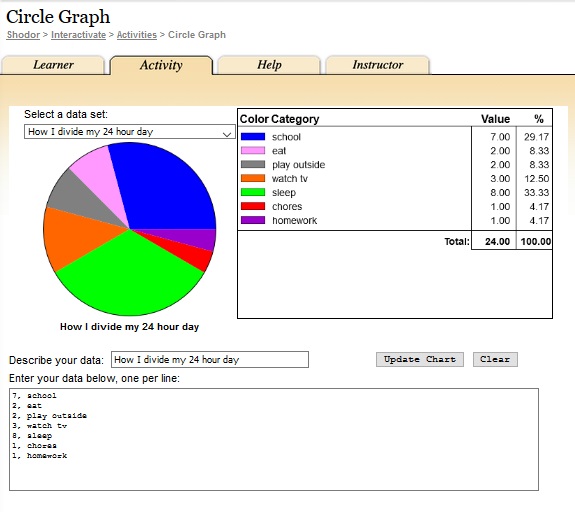
6. Circle Graph.
Click Image to Enlarge
Enter data categories and the value of each category to create a circle graph (similar to "Pie Chart" but the user can define the data set). SEE MORE
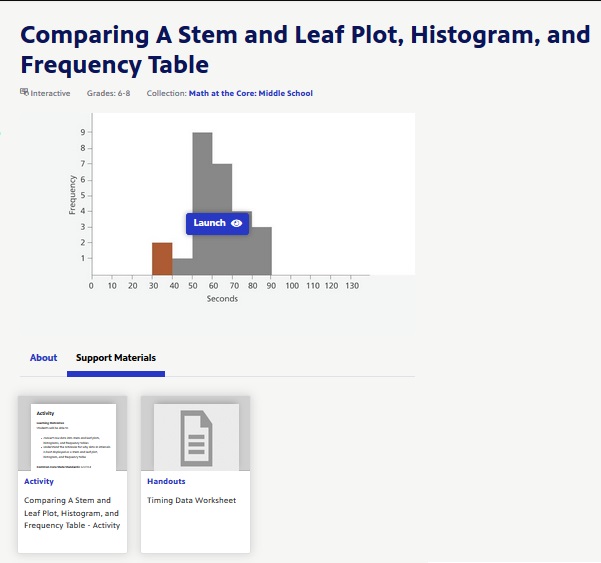
7. Comparing A Stem and Leaf Plot, Histogram, and Frequency Table.
Click Image to Enlarge
Compare and contrast the appearance of the same data arranged on a stem and leaf plot, histogram, and frequency table. This interactive illustration focuses on representing data in different ways and provides the opportunity to determine how and why each plot or graph is chosen to display data in intervals. (Printed directions and worksheet available) SEE MORE
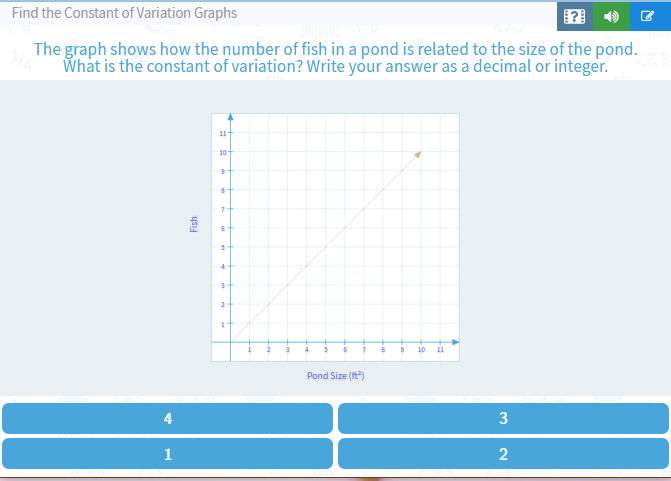
8. Find the Constant of Variation Graphs.
Click Image to Enlarge
Practice finding the constant of variation. SEE MORE
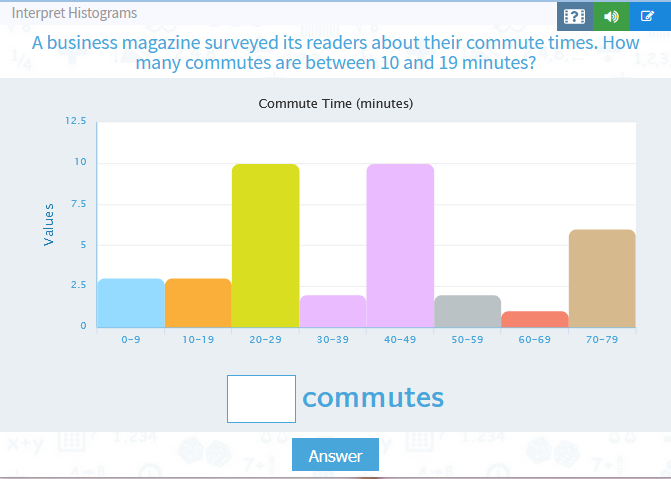
9. Interpret Histograms.
Click Image to Enlarge
Practice interpreting histograms to answer questions. SEE MORE
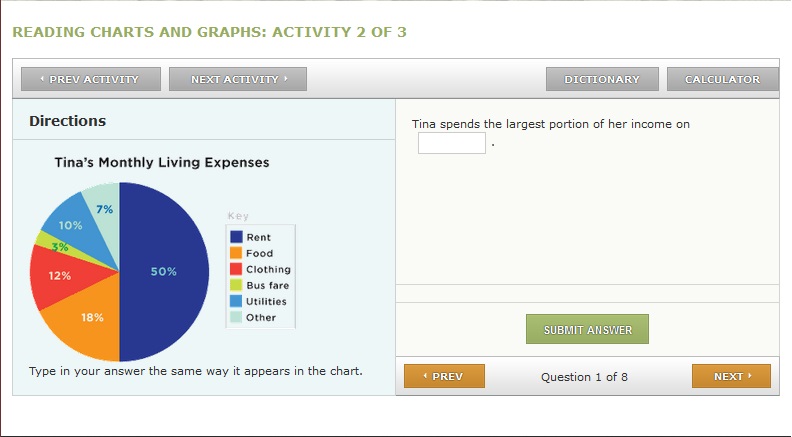
10. Interpreting Circle (Pie) Graphs.
Click Image to Enlarge
Students practice by answering eight questions about the graph. SEE MORE
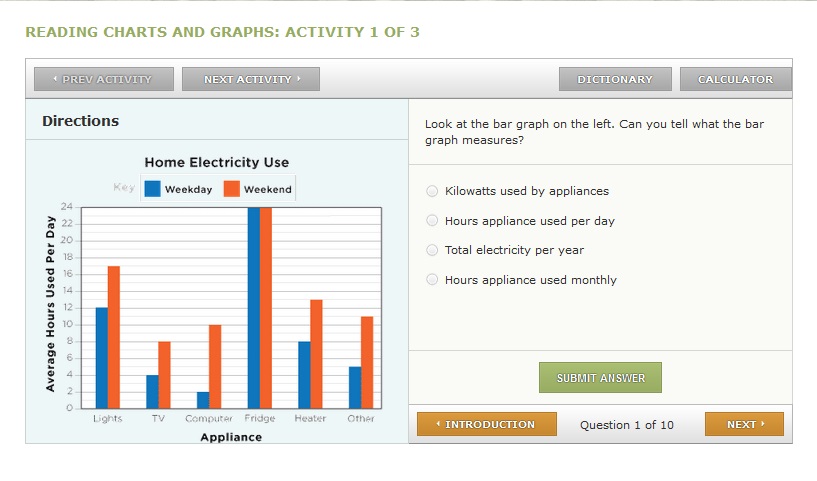
11. Interpreting Column (Bar) Graphs.
Click Image to Enlarge
Students practice by answering ten questions about the graph. SEE MORE
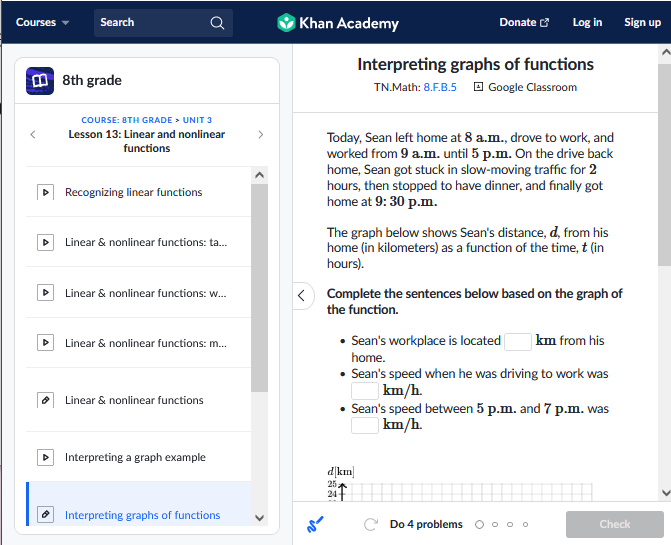
12. Interpreting graphs of functions.
Click Image to Enlarge
Complete sentences based on the graph of function. SEE MORE
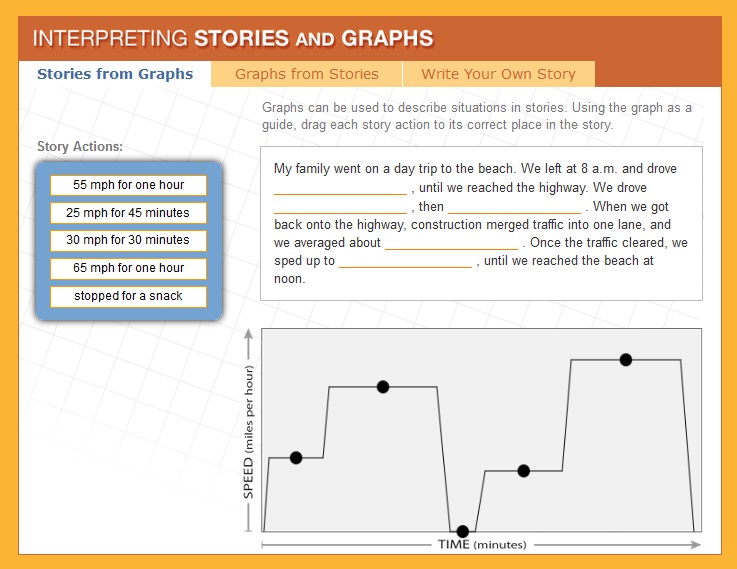
13. Interpreting Stories and Graphs.
Click Image to Enlarge
Demonstrate your problem solving skills by interpreting and sketching graphs. This interactive exercise focuses on how line graphs can be used to represent mathematical data and provides an opportunity to translate actions from a story into graph form, then to write your own story to coincide with a line graph. SEE MORE
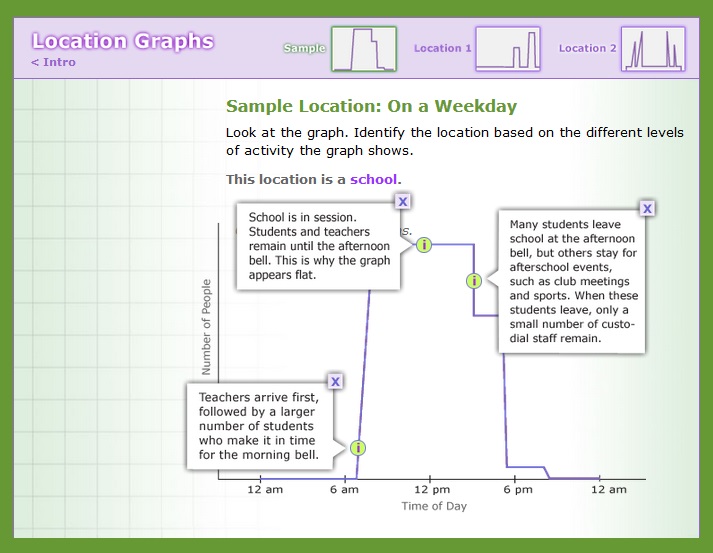
14. Location Graphs.
Click Image to Enlarge
Use your skills of deduction to fill in the missing information and demonstrate your expertise at interpreting graphs. SEE MORE
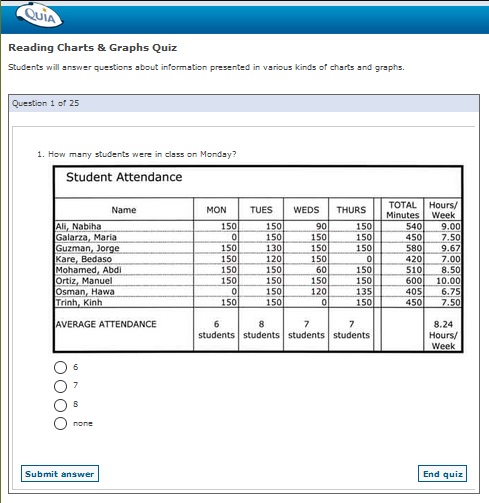
15. Reading Charts and Graphs Quiz.
Click Image to Enlarge
Answer questions about information presented in various kinds of charts and graphs. SEE MORE
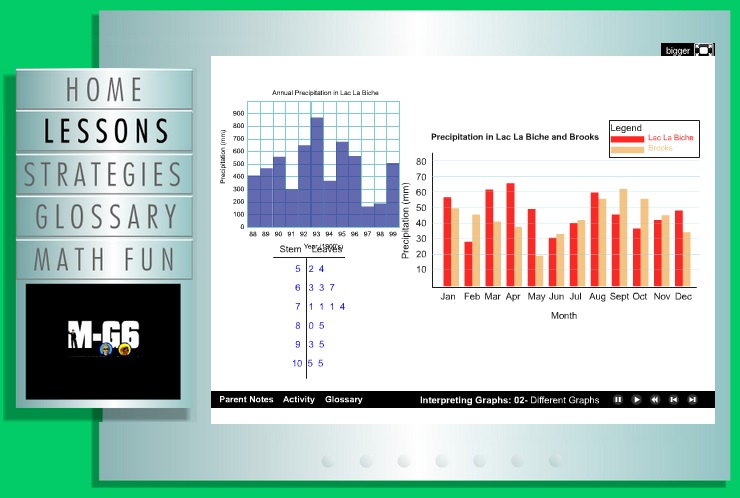
16. Spy Guys Interactive - Understanding and Interpreting Graphs.
Click Image to Enlarge
Watch the video and respond at various places Lesson 10. This video includes sections which ask students to input responses. SEE MORE

Internet4classrooms is a collaborative effort by
Susan Brooks and Bill Byles.

advertisement
advertisement
Use of this Web site constitutes acceptance of our Terms of Service and Privacy Policy.