| Sign Up For Our Newsletter |
| Sign Up For Our Newsletter |
Data Analysis - CCSS 3.MD.B.3
Links verified on 03/29/2023
1. All The Parts.
Click Image to Enlarge
Students learn the parts of different types of graphs. SEE MORE
2. Bar Graph.
Click Image to Enlarge
Enter data to create a bar graph, then manipulate the graph's maximum and minimum values. (Worksheets available under the "learner" tab.) SEE MORE
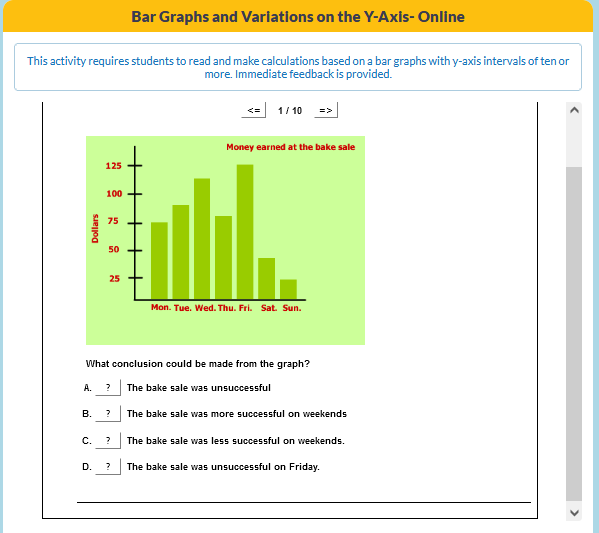
3. Bar Graphs and Variations on the Y-Axis.
Click Image to Enlarge
This activity requires students to read and make calculations based on a bar graphs with y-axis intervals of ten or more. Immediate feedback is provided. SEE MORE
4. Bugs in the System!
Click Image to Enlarge
Drag the bugs into the column of the same color to create a graph. SEE MORE
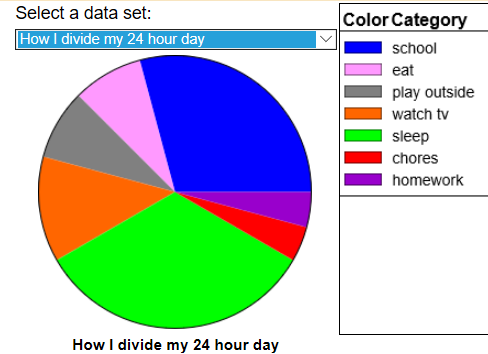
5. Circle Graph.
Click Image to Enlarge
Enter data categories and the value of each category to create a circle graph (similar to "Pie Chart" but the user can define the data set). (Additional activities and worksheets available under the "learner" tab.) SEE MORE
6. Create your own Bar Graph.
Click Image to Enlarge
Use the data given to create your own bar graph. SEE MORE
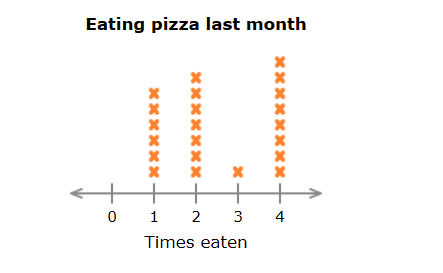
7. Create your own Line Plot.
Click Image to Enlarge
Use the given data to create your own line plot. SEE MORE
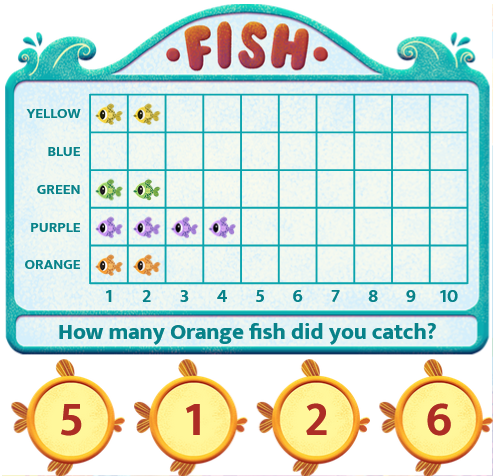
8. Fishing (Pictogram).
Click Image to Enlarge
Catch the fish and then use the pictogram to count how many of each fish were caught. SEE MORE
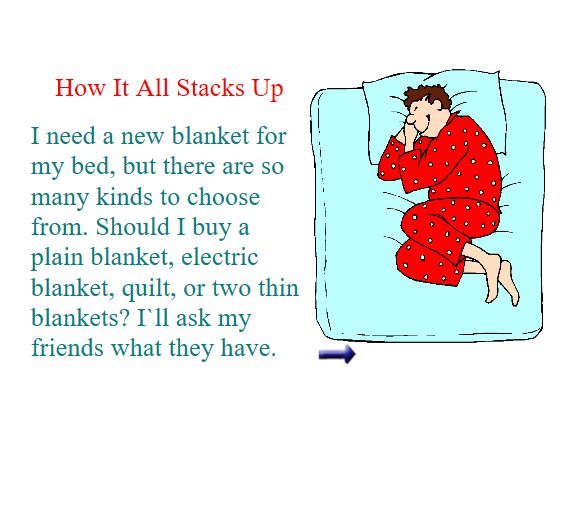
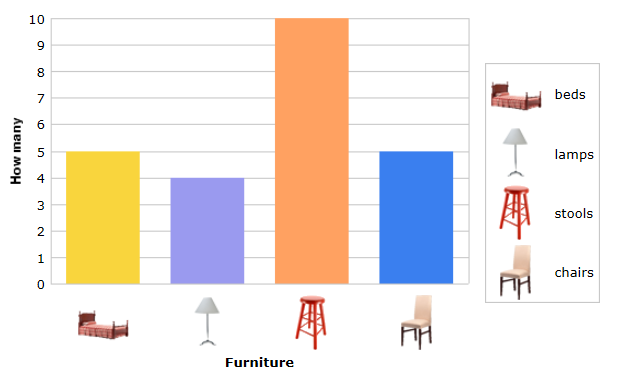
9. How It All Stacks Up.
Click Image to Enlarge
Interpret and compare information using a bar graph. SEE MORE
10. Interpret Bar Graphs II.
Click Image to Enlarge
Read the graph and answer the questions in this game. SEE MORE
11. Interpret Bar Graphs.
Click Image to Enlarge
Read the graph and answer the questions in this game. SEE MORE
12. Interpret Line Plots.
Click Image to Enlarge
Student answer questions on this quiz, reading the line plots. SEE MORE
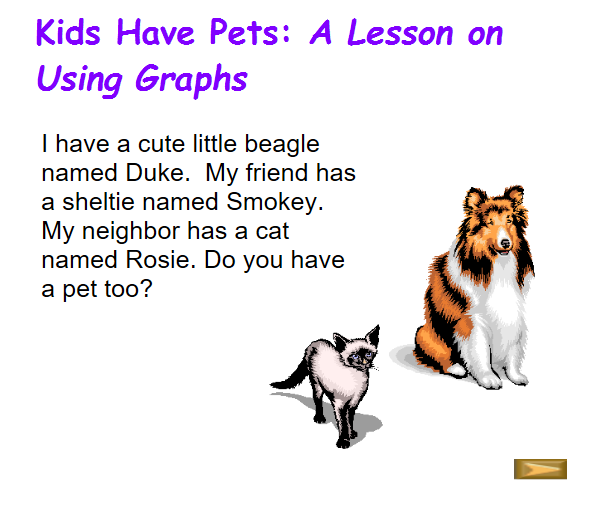
13. Kids Have Pets.
Click Image to Enlarge
Students learn about the parts of a bar graph and how to collect information. SEE MORE
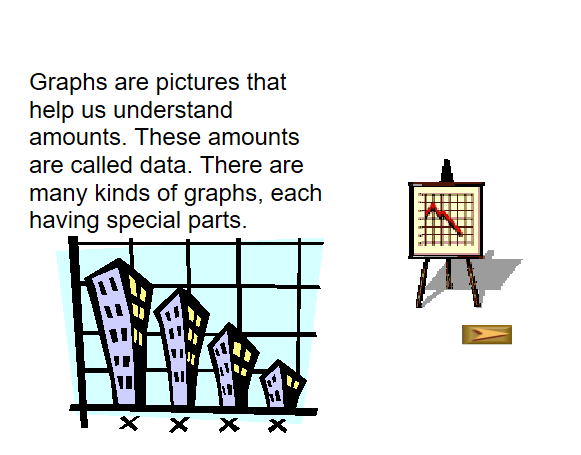
14. Kinds Of Graphs.
Click Image to Enlarge
Learn about various types of graphs. SEE MORE
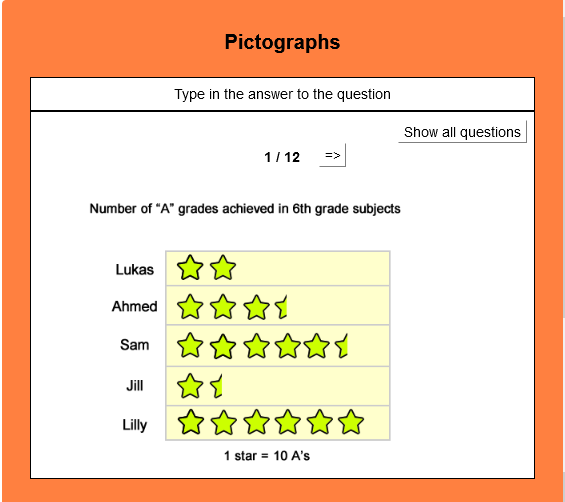
15. Pictographs.
Click Image to Enlarge
This activity requires students to answer questions based on pictograms. It gives immediate feedback. SEE MORE
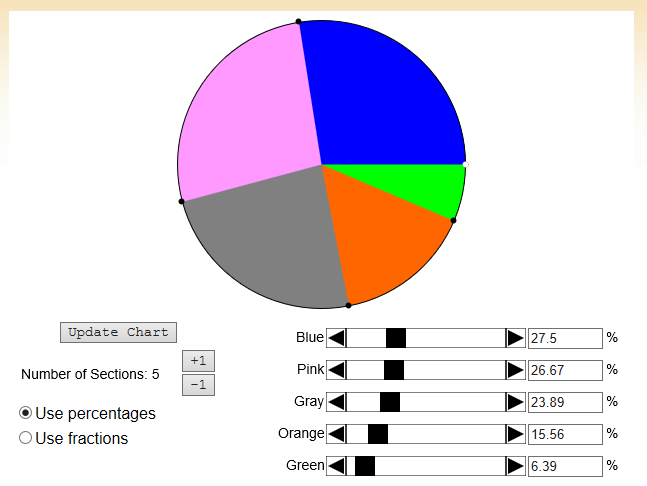
16. Pie Chart.
Click Image to Enlarge
Make pie charts. Additional resources are available. SEE MORE
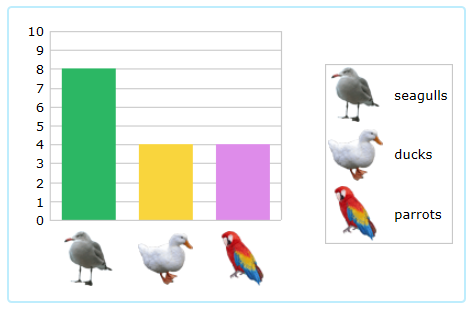
17. Play Ball.
Click Image to Enlarge
Use the picture graphs to answer questions. SEE MORE
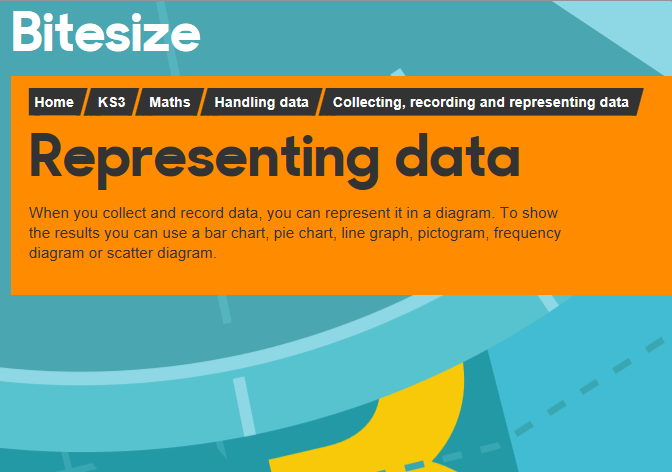
18. Representing Data.
Click Image to Enlarge
When you collect and record data, you can represent it in a diagram. Learn how to show the results using a bar chart, pie chart, line graph, pictogram, frequency diagram or scatter diagram. (Includes activity, glossary, guide, and test.) SEE MORE
19. Study Jam: Data Analysis.
Click Image to Enlarge
Choose "Data Analysis" from the list of math topics. Video lessons on the following: line plots, median, range, bar graphs, circle graphs, double-line graphs, mean/average, mode, pictograph, stem-and-leaf, histograms, and choosing the correct graph. (Test yourself included) SEE MORE
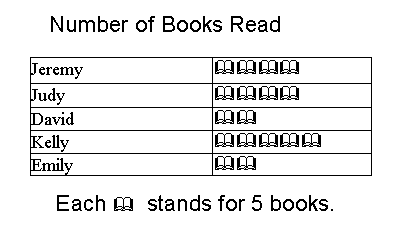
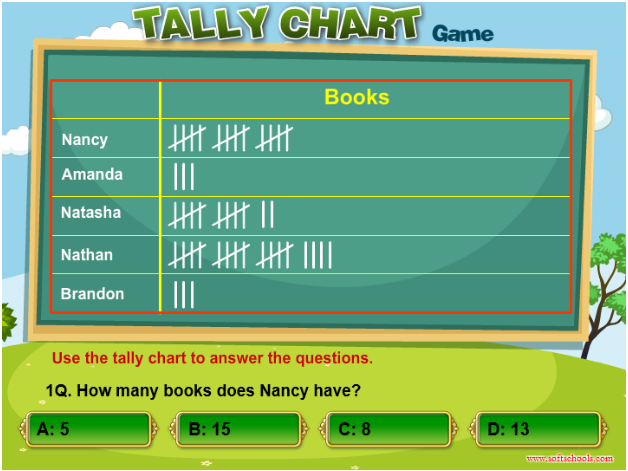
20. Tally Chart.
Click Image to Enlarge
Use the tally chart to answer the questions in this quiz. The graph shows the nuumber of books collected by each student. There are five questions. SEE MORE
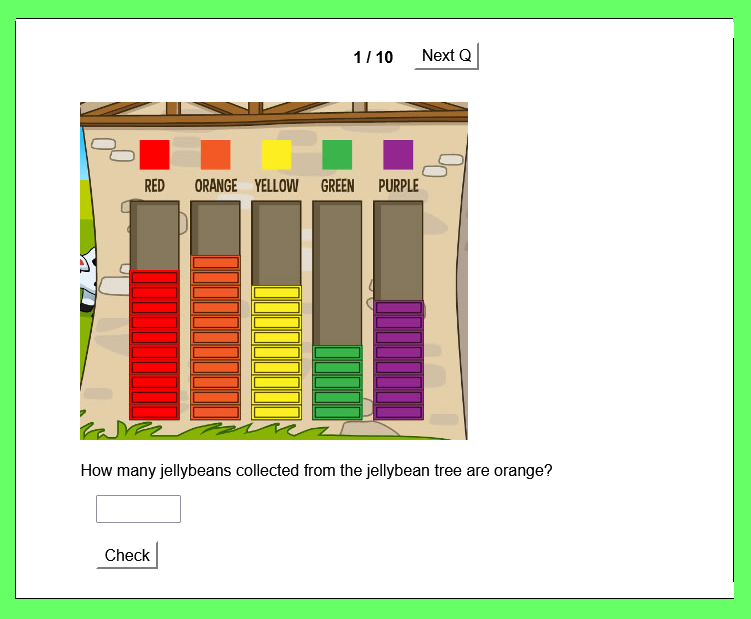
21. The Jellybean Tree Practice.
Click Image to Enlarge
This online bar graph activity will help you get ready to play The Jellybean Tree. Immediate feedback is provided. SEE MORE
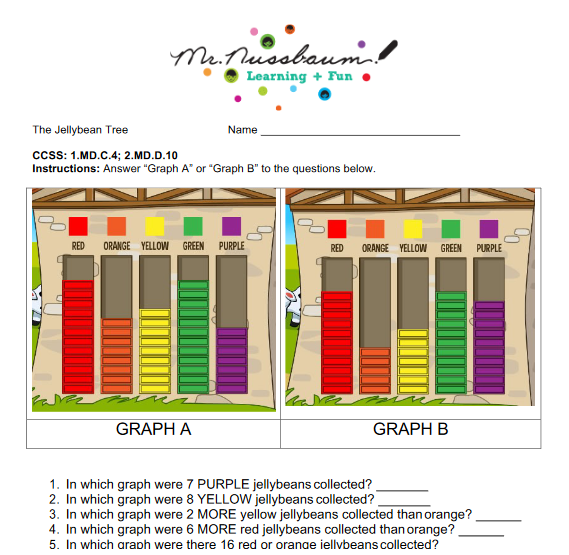
22. The Jellybean Tree Printable Practice.
Click Image to Enlarge
This printable practice of the Jellybean Tree will prepare students for the online game. SEE MORE
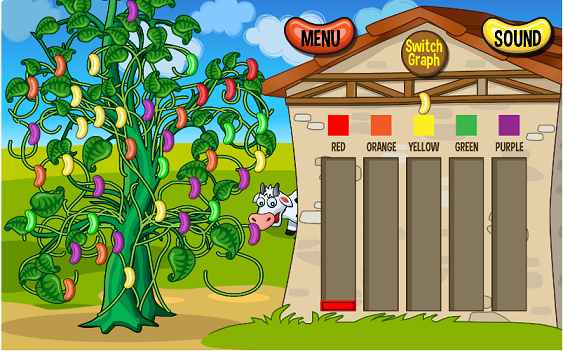
23. The Jellybean Tree.
Click Image to Enlarge
Watch as a tree sprouts with different colored jellybeans.“Pick” the jellybeans and drag and drop them to their correct places in a bar graph shown on the other side of the screen. The bar graph can be changed to a pie chart. Finally, the user must answer five questions involving the “jellybean tree.” SEE MORE
24. Which bar graph is correct?
Click Image to Enlarge
Read each question and identify the graph that answers the given question. SEE MORE

Internet4classrooms is a collaborative effort by
Susan Brooks and Bill Byles.

advertisement
advertisement
Use of this Web site constitutes acceptance of our Terms of Service and Privacy Policy.