| Sign Up For Our Newsletter |
| Sign Up For Our Newsletter |
Data Analysis and Graphs - CCSS 6.SP.B.4, 6.SP.B.5
Links verified on 11/13/2023
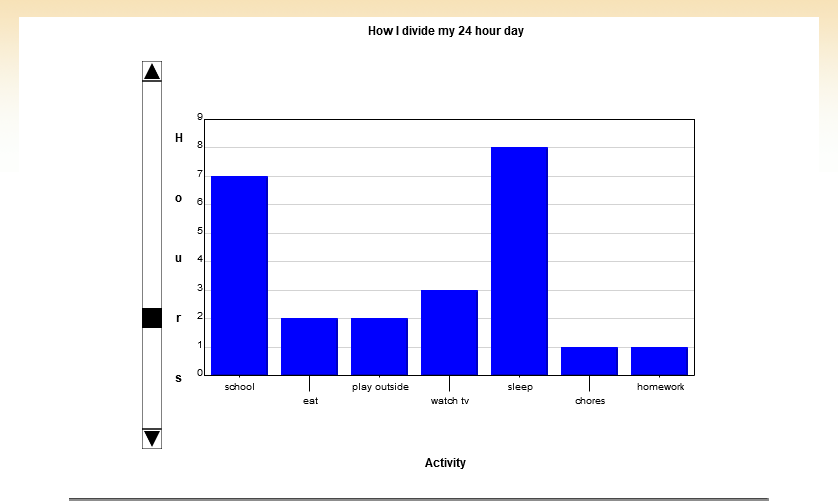
1. Bar Graph.
Click Image to Enlarge
Enter data to create a bar graph, then manipulate the graph's maximum and minimum values. Additional related resources available under the learner tab. SEE MORE
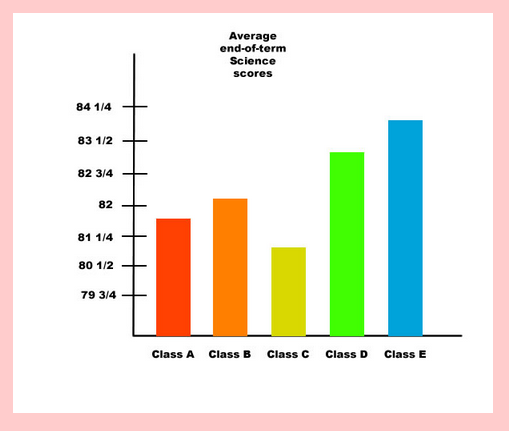
2. Bar Graphs and Fractions V1.
Click Image to Enlarge
This activity requires students to answer questions based on bar graphs with fractions. It gives immediate feedback SEE MORE
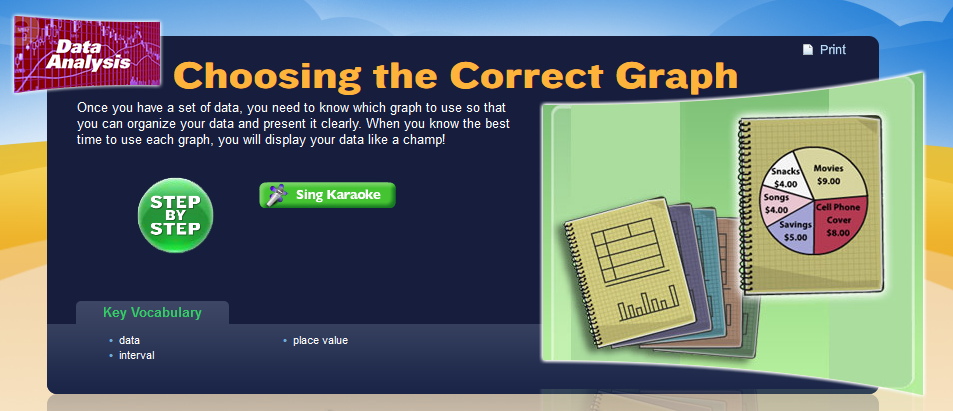
3. Choosing the Correct Graph.
Click Image to Enlarge
Once you have a set of data, you need to know which graph to use so that you can organize your data and present it clearly. When you know the best time to use each graph, you will display your data like a champ! SEE MORE
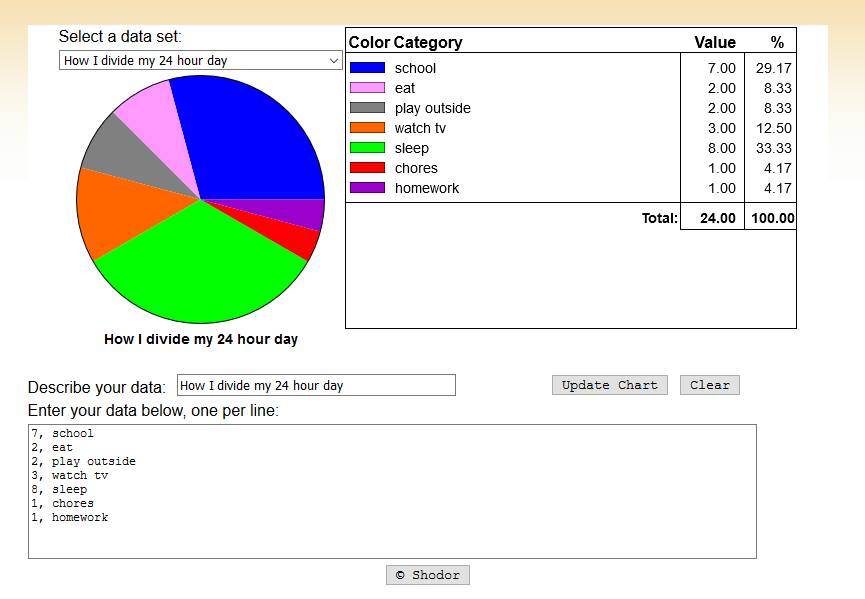
4. Circle Graph.
Click Image to Enlarge
Enter data categories and the value of each category to create a circle graph (similar to "Pie Chart" but the user can define the data set). Additional related resources under the learner tab. SEE MORE
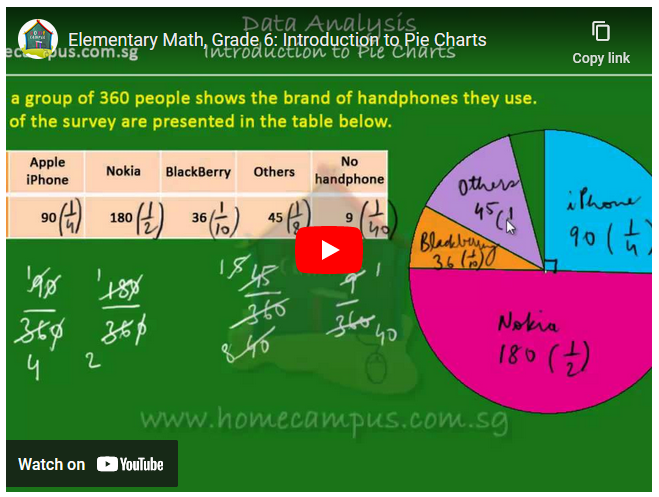
5. Data Analysis.
Click Image to Enlarge
Learn how to read, make and interpret pie charts. Includes video lessons, examples and solutions to help students to learn about pie charts and word problems. SEE MORE
6. Khan Academy - Data and Statistics.
Click Image to Enlarge
Collect and use data to make smart predictions about the world around you! Learn how to compare outcomes, to visualize the shape of the data, and to pick a graph type that shows its key features. SEE MORE
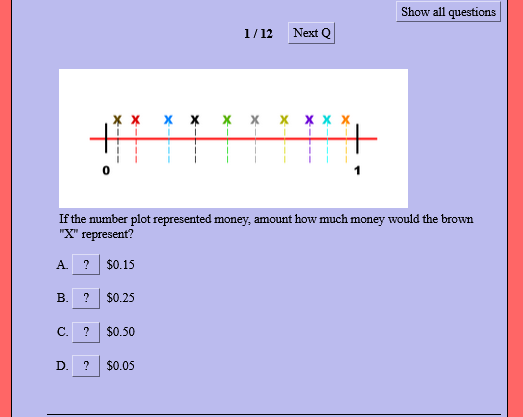
7. Line Plots with Fractions.
Click Image to Enlarge
This activity requires students to answer questions based on line plot with fractions. It gives immediate feedback SEE MORE
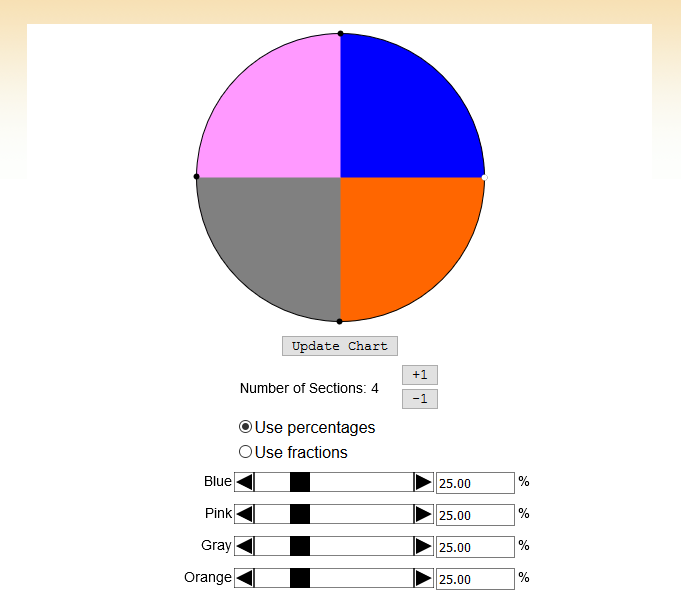
8. Pie Chart.
Click Image to Enlarge
Students view pie charts (parameters: number of sectors, size of sector as a percent). SEE MORE
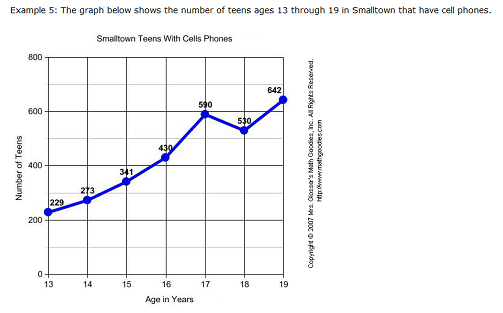
9. Reading and Interpreting a Line Graphs.
Click Image to Enlarge
Lesson includes examples, vocabulary, questions with answers. Exercise available at the end. Also includes addition lessons on data and graphs. SEE MORE
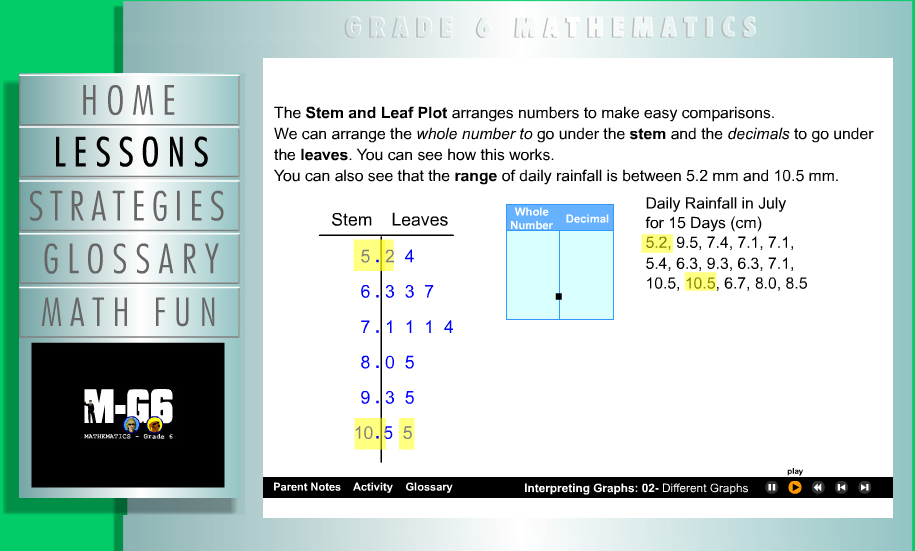
10. Spy Guys Interactive - Understanding and Interpreting Graphs.
Click Image to Enlarge
Watch the video and respond at various places Lesson 10. This video includes sections which ask students to inpur responses SEE MORE
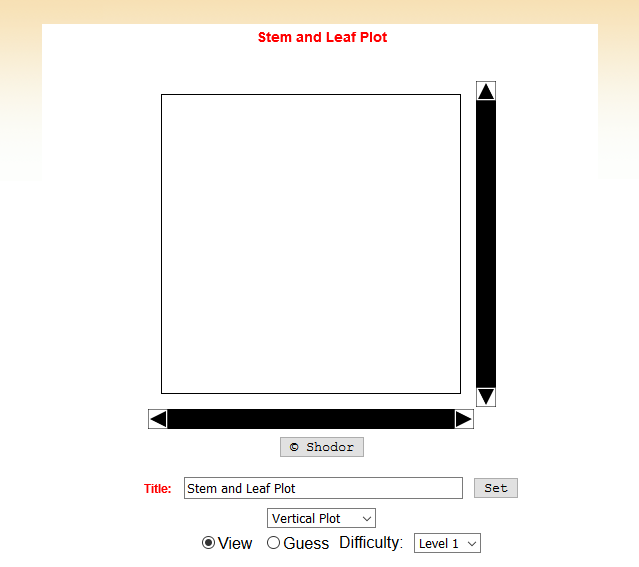
11. Stem and Leaf Plotter.
Click Image to Enlarge
An interactive applet that allow students to input data. Additional related resources available under the learner tab. SEE MORE
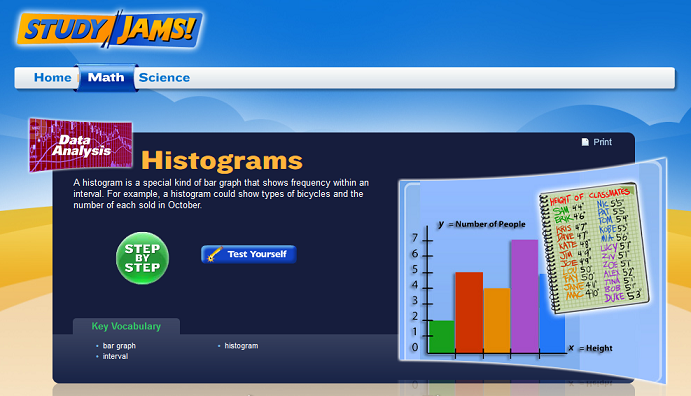
12. Study Jams - Data Analysis - Histograms.
Click Image to Enlarge
Guided step by step solutions to sample problems. Students are able to practice the skills. Includes definition of vocabulary words and a chance to test themselves. SEE MORE

Internet4classrooms is a collaborative effort by
Susan Brooks and Bill Byles.

advertisement
advertisement
Use of this Web site constitutes acceptance of our Terms of Service and Privacy Policy.