| Sign Up For Our Newsletter |
| Sign Up For Our Newsletter |
Data Analysis with Graphs - CCSS 5.GA.1, 5.GA.2, Mathematical Practices
Links verified on 12/22/2022
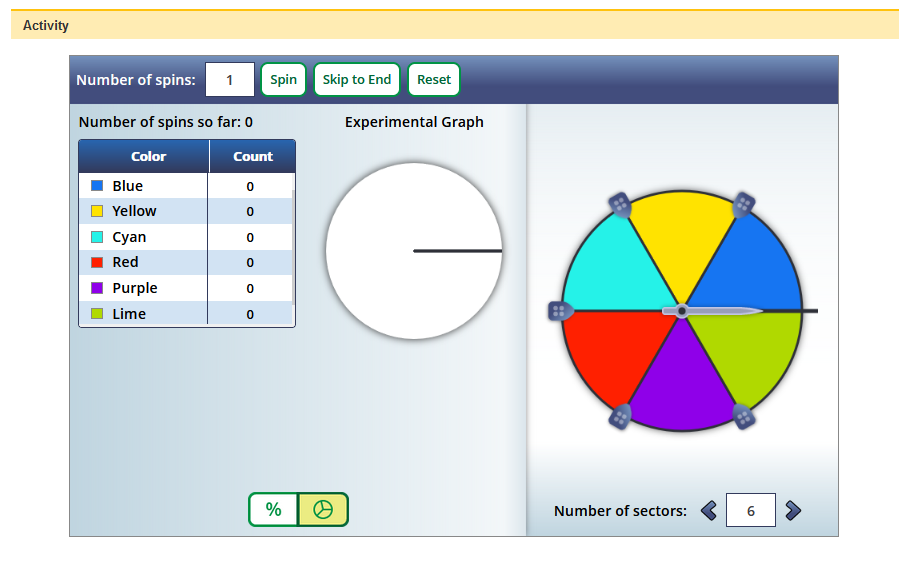
1. Adjustable Spinner.
Click Image to Enlarge
Conduct a probability experiment by creating a spinner of you own choice and spinning it many times. See how your results compare with the theoretical probability. SEE MORE
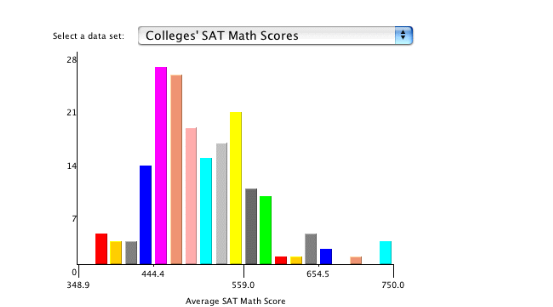
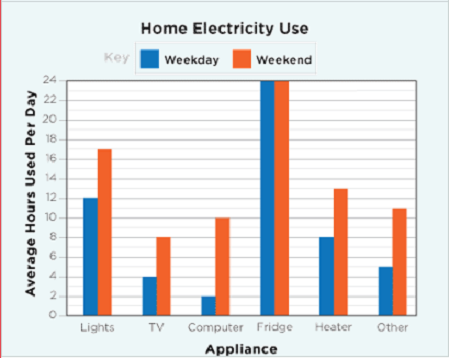
2. Bar Graph.
Click Image to Enlarge
Enter data to create a bar graph, then manipulate the graph's maximum and minimum values. (Printable instructions and additional resources available under the learner tab.) SEE MORE
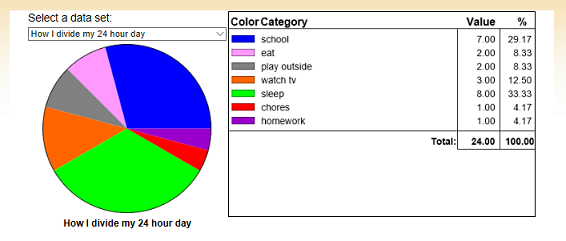
3. Circle Graph.
Click Image to Enlarge
Enter data categories and the value of each category to create a circle graph. (Additional resources under the learner tab.) SEE MORE
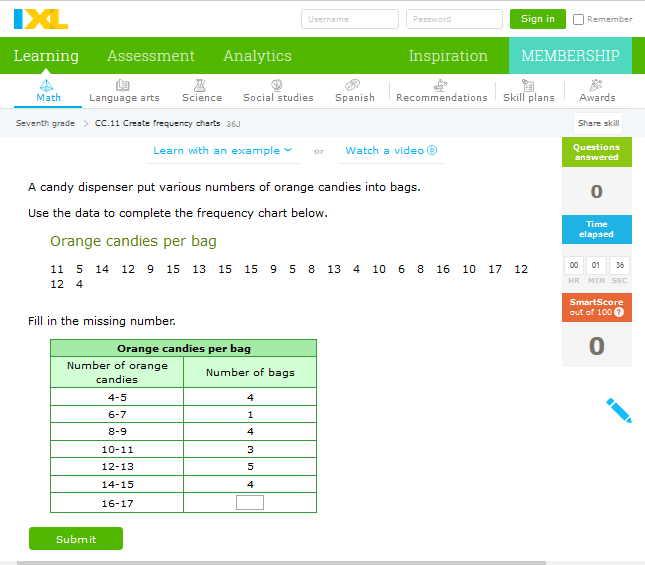
4. Frequency Charts.
Click Image to Enlarge
Use given data to complete the frequency charts shown. SEE MORE
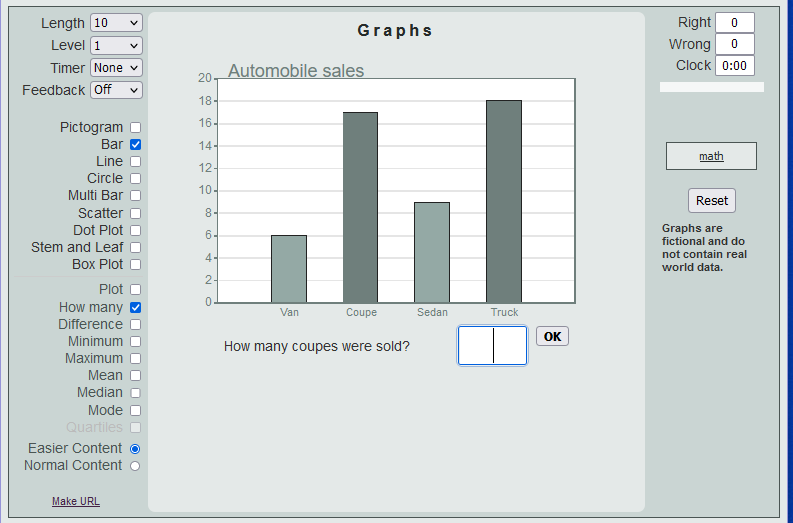
5. Graphs.
Click Image to Enlarge
This quiz asks questions about different kinds of graphs (bar, line, circle graph, multi-bar, stem-and-leaf, box plot, scatter graph). You can modify the quiz. SEE MORE
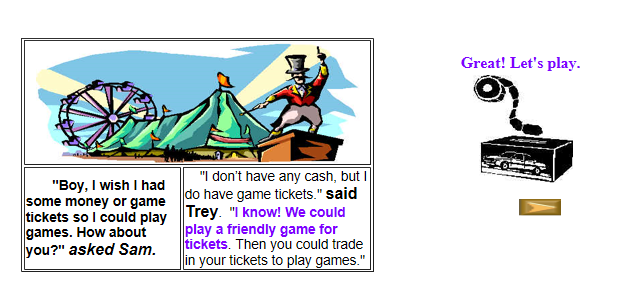
6. Heads I Win.
Click Image to Enlarge
Predict the likelihood of tossing heads or tails and graphs the results of coin tosses. SEE MORE
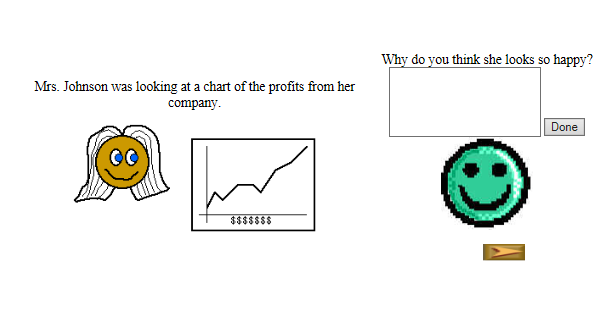
7. Interpreting Line Graphs.
Click Image to Enlarge
Explore line graphs with this interactive lesson. SEE MORE
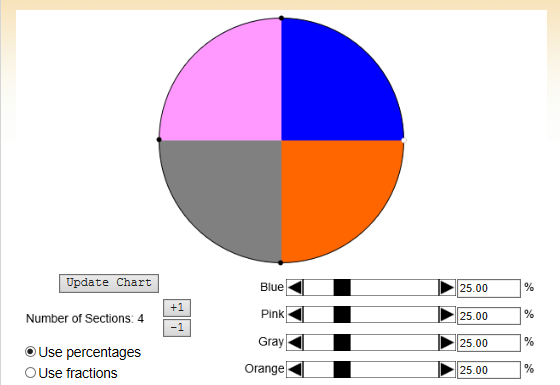
8. Pie Chart.
Click Image to Enlarge
An interactive activity to view and create pie charts. (Additional resources under learner tab.) SEE MORE
9. Piece Of Pie.
Click Image to Enlarge
Interactive lesson using a circle graph. SEE MORE
10. Push Ups.
Click Image to Enlarge
Collect data to put on a line graph. SEE MORE
11. Reading Charts and Graphs.
Click Image to Enlarge
Compare types of information shown in different kinds of charts SEE MORE
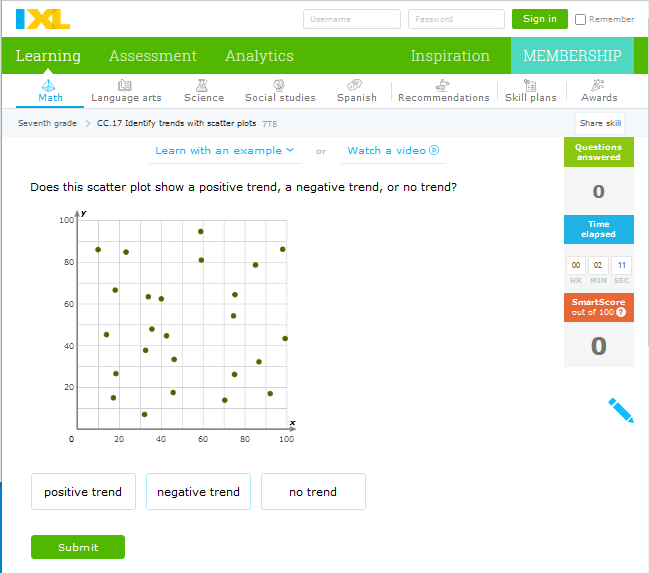
12. Scatter Plots.
Click Image to Enlarge
Identify trends with scatter plots. (positive, negative, or no trends) SEE MORE
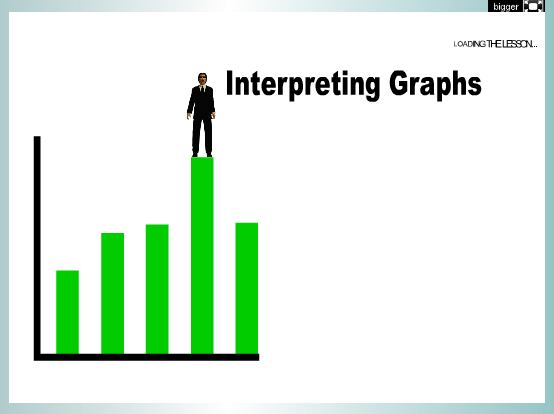
13. Spy Guys Interactive - Interpreting Graphs.
Click Image to Enlarge
Watch the video and respond at various places. SEE MORE
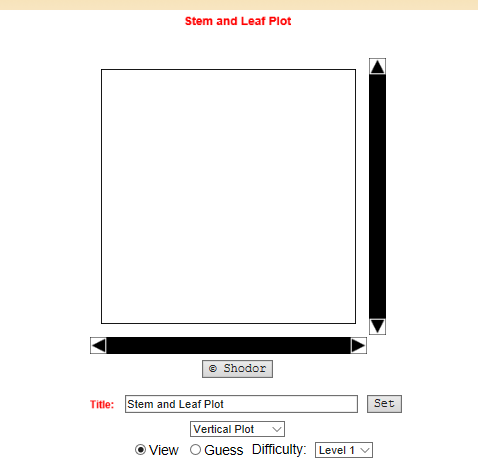
14. Stem and Leaf Plotter.
Click Image to Enlarge
An interactive applet that allow students to input data. (Additional resources under learner tab.) SEE MORE

Internet4classrooms is a collaborative effort by
Susan Brooks and Bill Byles.

advertisement
advertisement
Use of this Web site constitutes acceptance of our Terms of Service and Privacy Policy.