| Sign Up For Our Newsletter |
| Sign Up For Our Newsletter |
Interpret Graphs - CCSS RST.6-8.7
Links verified on 12/14/2022
1. Reading Charts & Graphs Quiz.
Click Image to Enlarge
Students will answer 25 questions about information presented in various kinds of charts and graphs. SEE MORE
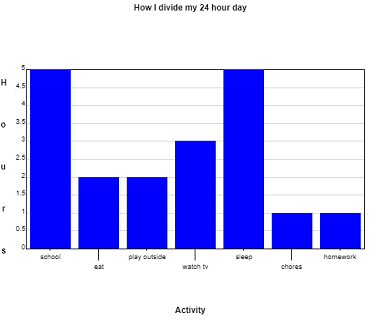
2. Bar Graph.
Click Image to Enlarge
Enter data to create a bar graph, then manipulate the graph's maximum and minimum values. SEE MORE
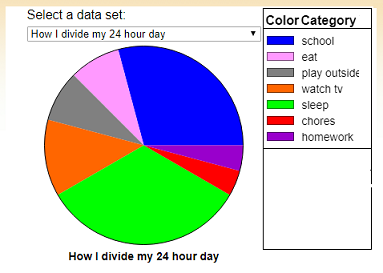
3. Circle Graph.
Click Image to Enlarge
Enter data categories and the value of each category to create a circle graph (similar to "Pie Chart" but the user can define the data set). (Additional resources located under the "learner" tab.) SEE MORE
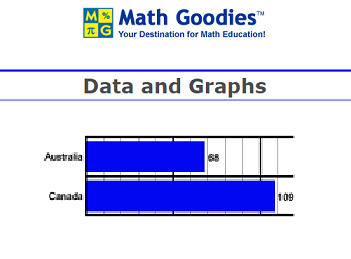
4. Data and Graphs.
Click Image to Enlarge
This Data and Graphs unit shows students how to read and interpret line, bar and circle graphs. Students are also shown how to construct these graphs from data in a table. They will then learn how to determine which graphs are appropriate for a given set of data. SEE MORE
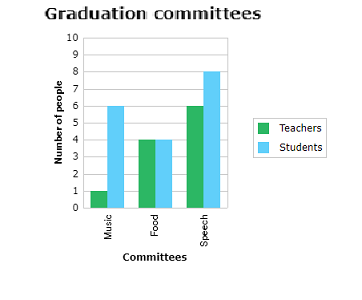
5. Interpret Bar Graphs.
Click Image to Enlarge
Fun math practice! Improve your skills with problems in interpreting bar graphs. SEE MORE
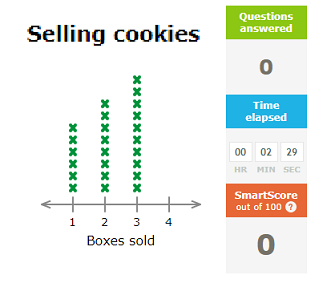
6. Interpret Line Plots.
Click Image to Enlarge
Practice interpreting line plots by answering questions using different line plots. SEE MORE
7. Interpreting Circle (Pie) Graphs.
Click Image to Enlarge
Students practice by answering eight questions about the graph. SEE MORE
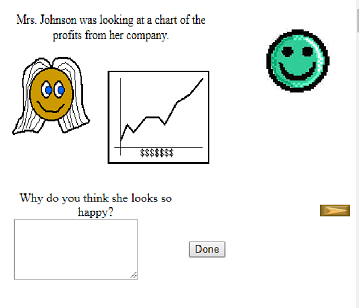
8. Interpreting Line Graphs.
Click Image to Enlarge
Explore a lesson line graphs. SEE MORE
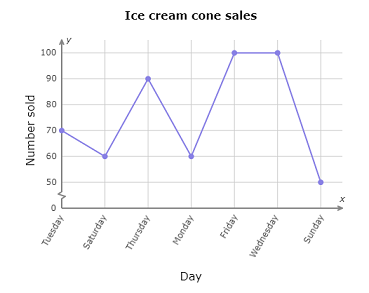
9. Interpreting Line Graphs.
Click Image to Enlarge
Fun math practice! Improve your skills in interpreting line graphs. SEE MORE
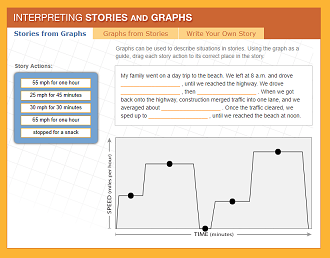
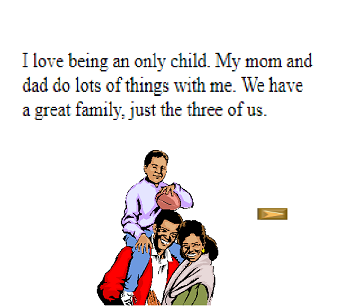
10. Interpreting Stories and Graphs.
Click Image to Enlarge
Demonstrate your problem solving skills by interpreting and sketching graphs. This interactive exercise focuses on how line graphs can be used to represent mathematical data and provides an opportunity to translate actions from a story into graph form, then to write your own story to coincide with a line graph. SEE MORE
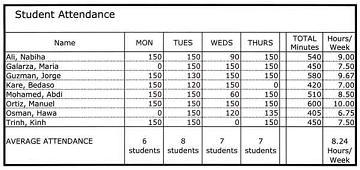
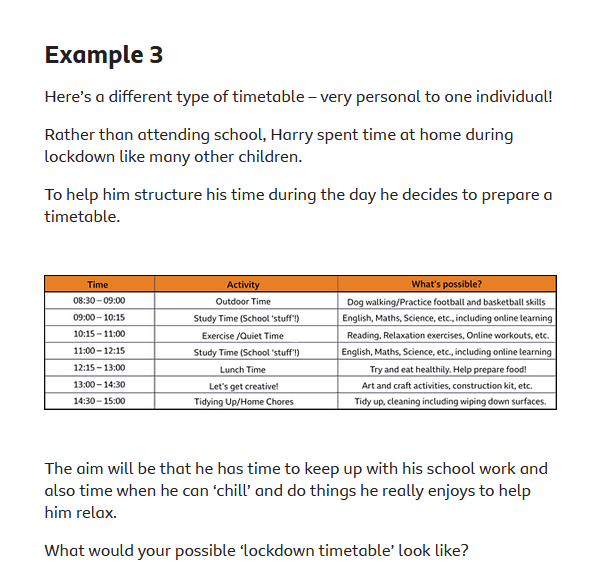
11. Interpreting Timetables.
Click Image to Enlarge
Learn how to read and understand information offered in a variety of different formats and styles. This lesson will focus on understanding the information provided in different types of timetables! (Includes a quiz.) SEE MORE
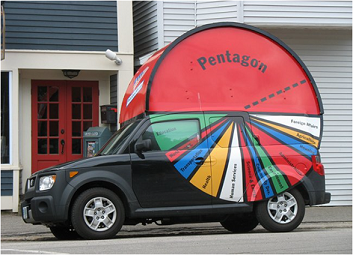
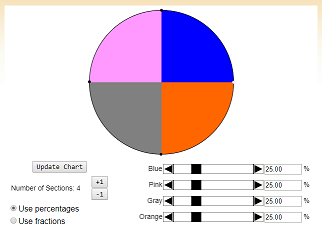
12. Pie Chart.
Click Image to Enlarge
Students view pie charts (parameters: number of sectors, size of sector as a percent). Additional resources under the "learner" tab. SEE MORE
13. Piece Of Pie.
Click Image to Enlarge
Review how to display data using a circle graph. SEE MORE
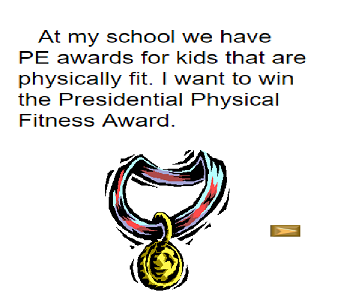
14. Push Ups.
Click Image to Enlarge
A lesson on how to collect data to put on a line graph. SEE MORE
15. Spy Guys Interactive.
Click Image to Enlarge
Understanding and Interpreting Graphs - Watch the video and respond at various places in this video lesson . This video includes sections which ask students to input responses. SEE MORE
16. Using and Handling Data.
Click Image to Enlarge
Multiple resources for introducing and practicing how to use and show data. SEE MORE

Internet4classrooms is a collaborative effort by
Susan Brooks and Bill Byles.

advertisement
advertisement
Use of this Web site constitutes acceptance of our Terms of Service and Privacy Policy.