| Sign Up For Our Newsletter |
| Sign Up For Our Newsletter |
Graphing and Coordinate Plane - CCSS 5.MD.B.2
Links verified on 04/14/2022
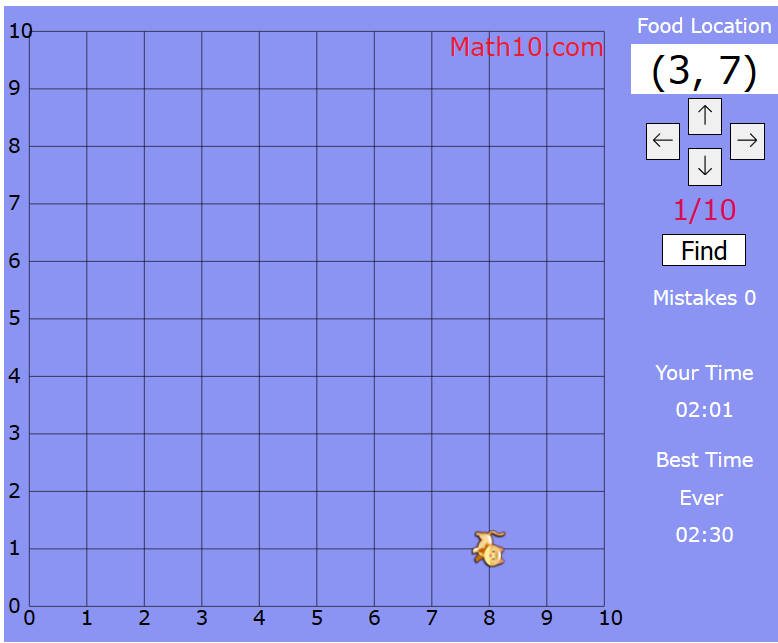
1. Cali and the Coordinate System.
Click Image to Enlarge
Move Cali on the given coordinates, which are only positive numbers. How long will it take you to feed Cali 10 times? SEE MORE
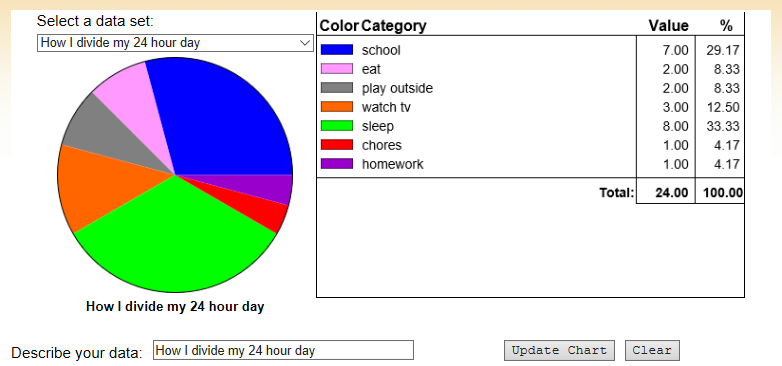
2. Circle Graph.
Click Image to Enlarge
Enter data categories and the value of each category to create a circle graph (similar to "Pie Chart" but the user can define the data set). (Printable resources under the "Learner" tab.) SEE MORE
3. Create A Bar Graph.
Click Image to Enlarge
Bar Graph - Enter data to create a bar graph, then manipulate the graph's maximum and minimum values. (Printable resources under "Learner" tab.) SEE MORE
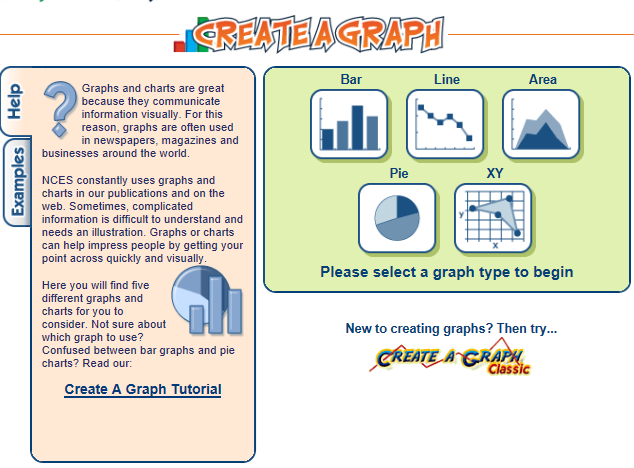
4. Create A Graph.
Click Image to Enlarge
Area Graph - Design and create your own graph. SEE MORE
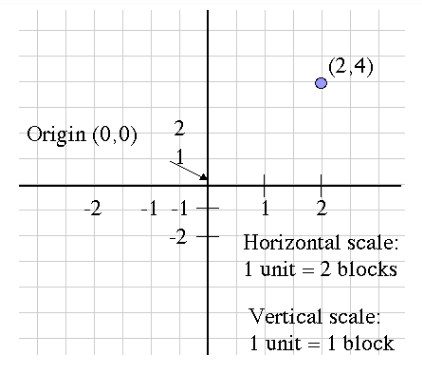
5. General Coordinates Game.
Click Image to Enlarge
Students investigate the Cartesian coordinate system through identifying the coordinates of points, or requesting that a particular point be plotted. (Printable resources under the "learner" tab.) SEE MORE
6. Grid Graph.
Click Image to Enlarge
Identify and plot points on a grid. SEE MORE
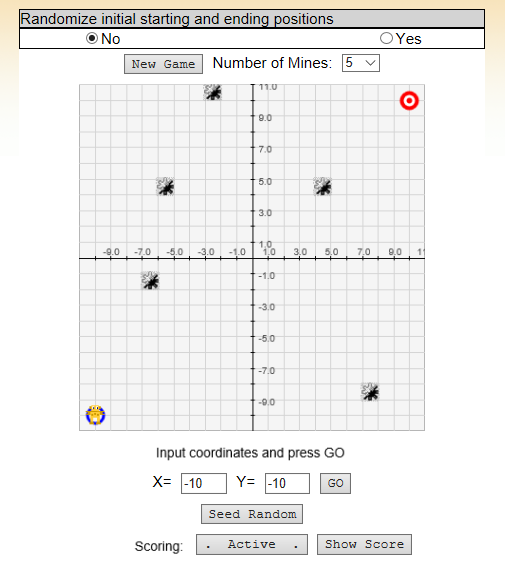
7. Maze Game.
Click Image to Enlarge
Students use their knowledge of points on a graph to move a robot to the target while avoiding mines. (Printable resources available under the "learner" tab.) SEE MORE
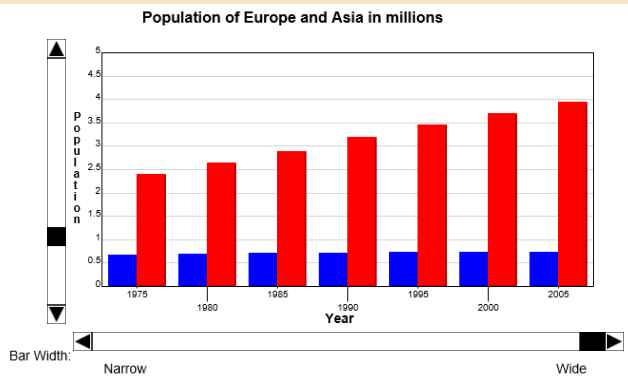
8. Multi Bar Graph.
Click Image to Enlarge
Enter data to create a double bar graph. Then, manipulate the graph's maximum and minimum values. SEE MORE
9. Pie Chart.
Click Image to Enlarge
Make your own pie charts. (Printable resources under the "learner" tab.) SEE MORE
10. Simple Coordinates Game.
Click Image to Enlarge
Students investigate the first quadrant of the Cartesian coordinate system through identifying the coordinates of points, or requesting that a particular point be plotted. (Printable resources available under the "learner" tab.) SEE MORE
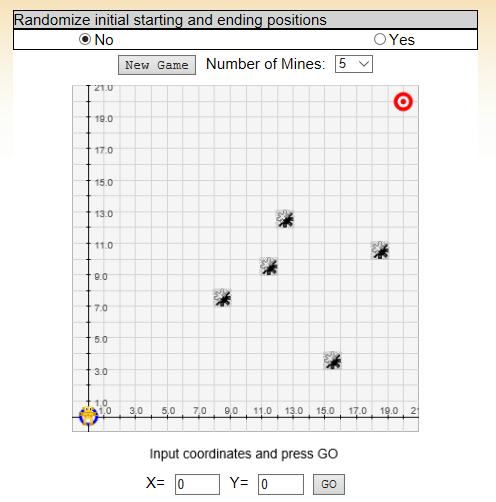
11. Simple Maze Game.
Click Image to Enlarge
Students investigate the first quadrant of the Cartesian coordinate system by directing a robot through a mine field laid out on the plane. (Printable resources available under the "learner" tab.) SEE MORE
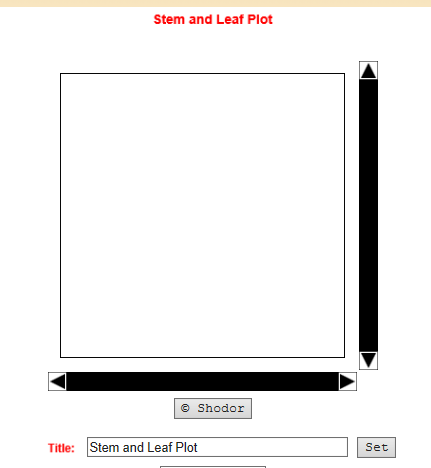
12. Stem and Leaf Plotter.
Click Image to Enlarge
Students view stem-and-leaf plots of their data and then practice finding means, medians and modes. (Printable resources under the "learner" tab.) SEE MORE
13. Stock the Shelves.
Click Image to Enlarge
You are the clerk. Stock the shelves using the coordinate plane. (Can be played on an iPad or Tablet.) SEE MORE
14. What's the Point?
Click Image to Enlarge
Choose a level. Find the x-y point on a grid. SEE MORE

Internet4classrooms is a collaborative effort by
Susan Brooks and Bill Byles.

advertisement
advertisement
Use of this Web site constitutes acceptance of our Terms of Service and Privacy Policy.