| Sign Up For Our Newsletter |
| Sign Up For Our Newsletter |
Data Analysis with Graphs - CCSS 8.F.B.5
Links verified on 01/30/2024
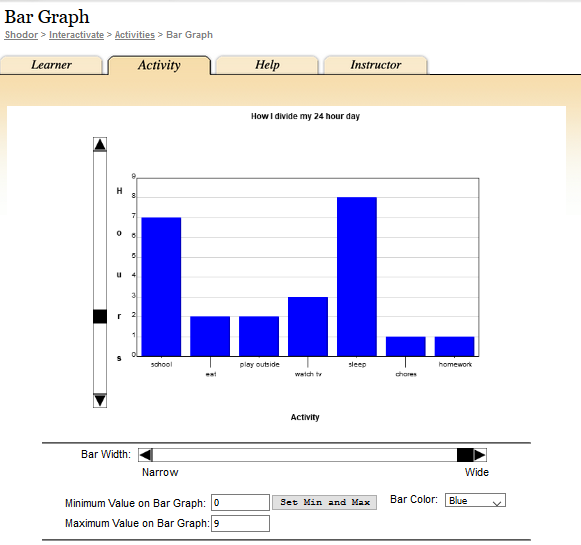
1. Bar Graph.
Click Image to Enlarge
Enter data to create a bar graph, then manipulate the graph's maximum and minimum values. Additional resources available under the learner tab. SEE MORE
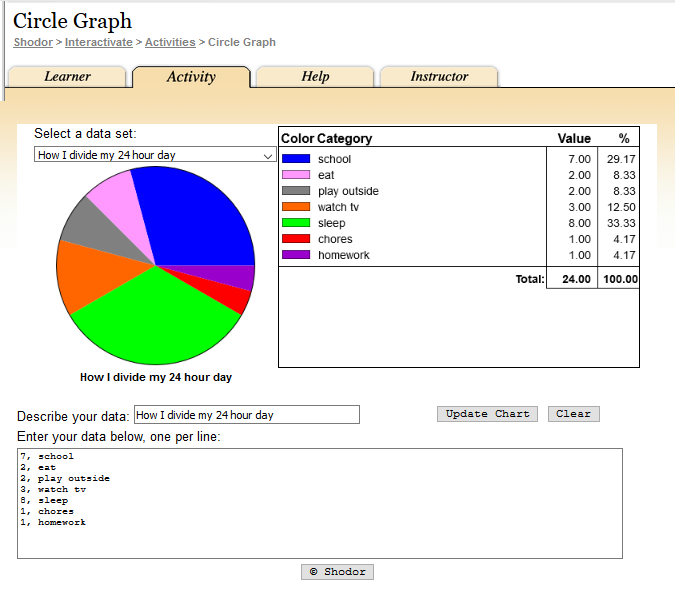
2. Circle Graph.
Click Image to Enlarge
Enter data categories and the value of each category to create a circle graph. Additional related resources available under the learner tab. SEE MORE
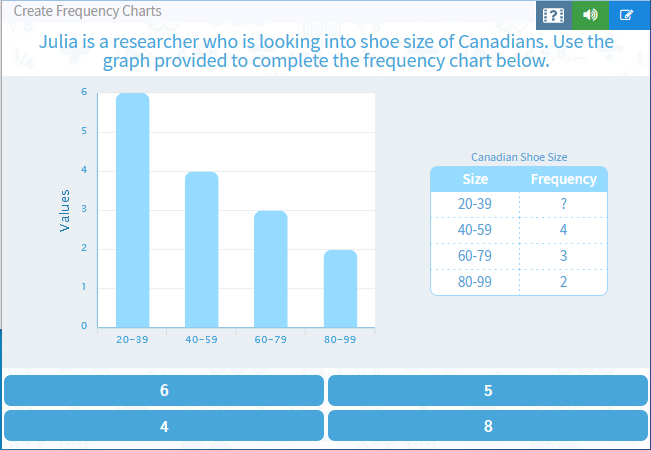
3. Create Frequency Charts.
Click Image to Enlarge
Use graphs to complete frequency charts. SEE MORE
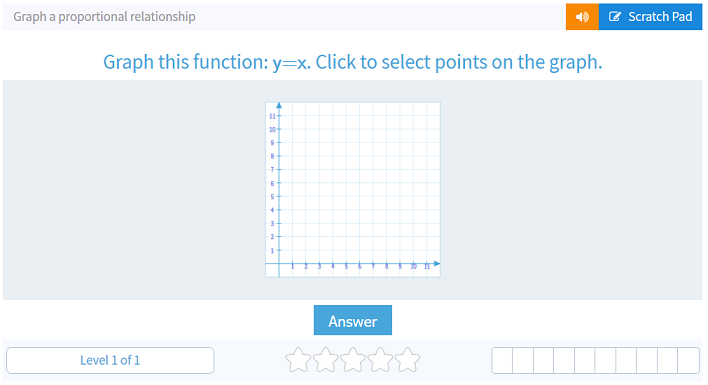
4. Graph a Proportional relationship.
Click Image to Enlarge
Graph a function: y=x. Click to select points on the graph. SEE MORE
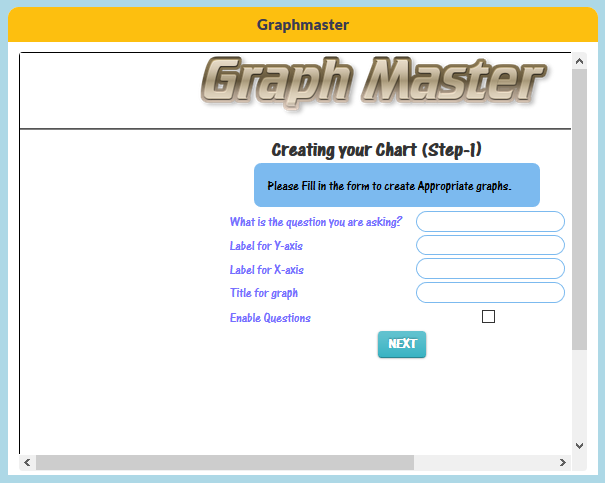
5. Graphmaster.
Click Image to Enlarge
Create four different graphs on one page. Display four different interactive graphs: bar, line, pie and frequency chart. This program analyzes data and generates eight multiple choice question about the data. SEE MORE
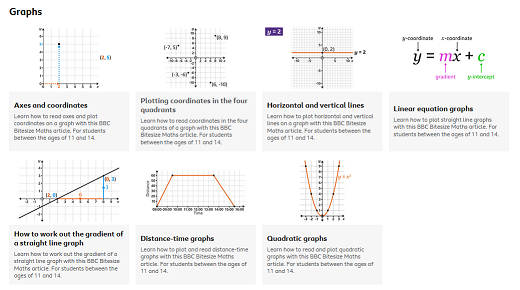
6. Graphs.
Click Image to Enlarge
Several learner guides on graphs, include opportunities to apply the learning. (Games are only available to users in the UK.) SEE MORE
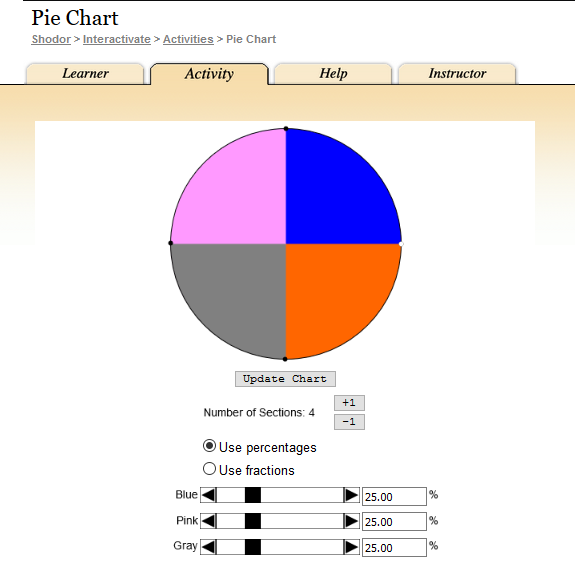
7. Interactive Pie Chart.
Click Image to Enlarge
Use this interactive applet to input data and create a graph. Additional resources available under the learner tab. SEE MORE
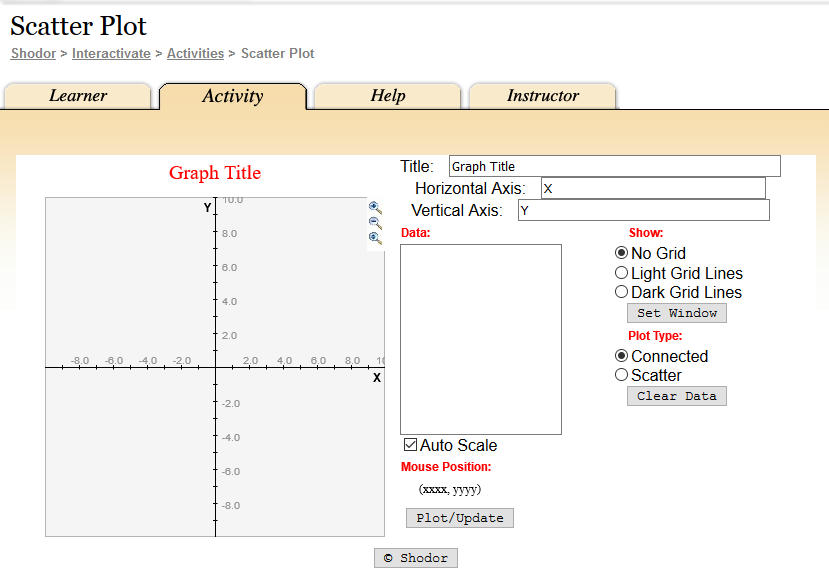
8. Interactive Scatter Plot.
Click Image to Enlarge
Use this interactive applet to input a series of (x, y) ordered pairs and plot them. Parameters such as minimum and maximum value, minimum and maximum y value, and x- and y-scale can be set by the user or determined by the applet. Additional related resources located under the learner tab. SEE MORE
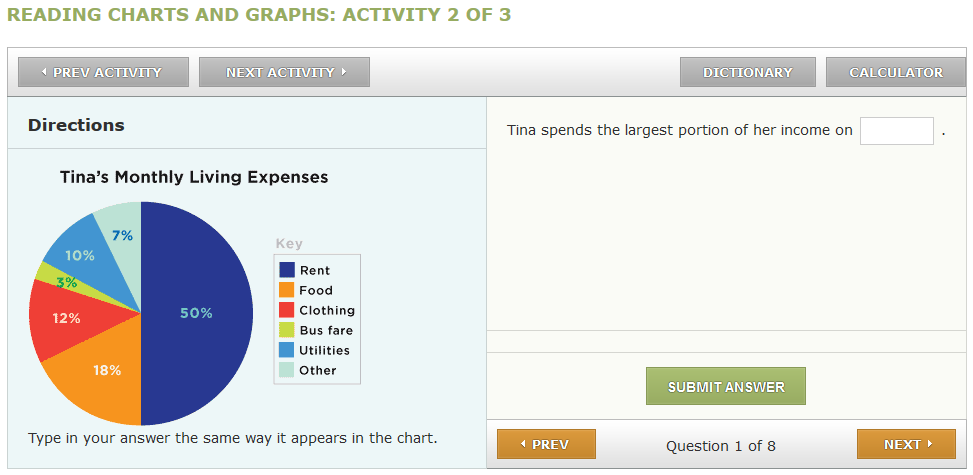
9. Interpreting Circle (Pie) Graphs.
Click Image to Enlarge
Practice by answering eight questions about pie graphs. SEE MORE
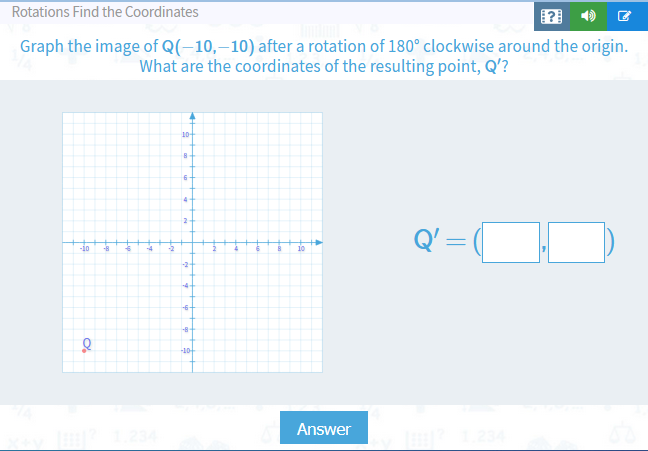
10. Rotations Find the Coordinates.
Click Image to Enlarge
Graph images then rotate to a discover the coordinates of a resulting point. SEE MORE
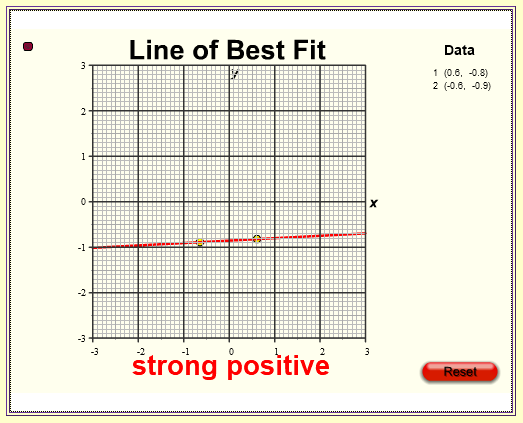
11. Scatter Plot and Line of Best Fit.
Click Image to Enlarge
Interactive grids to create your own scatterplots. Four interactive applets available. SEE MORE
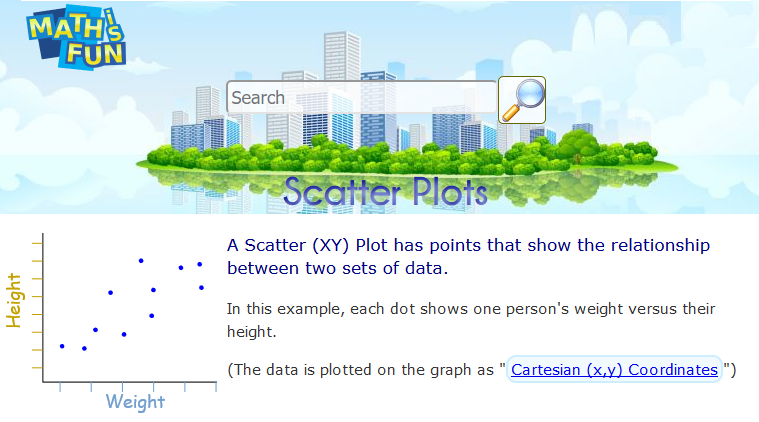
12. Scatter Plots.
Click Image to Enlarge
A lesson on scatter plots. This lesson includes examples with explanations. Twelve questions at the end of the lesson. SEE MORE
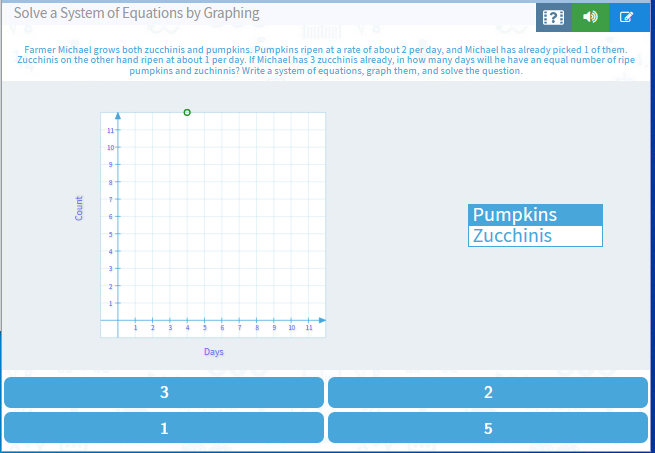
13. Solving Equations.
Click Image to Enlarge
Solve a system of equations by graphing. SEE MORE
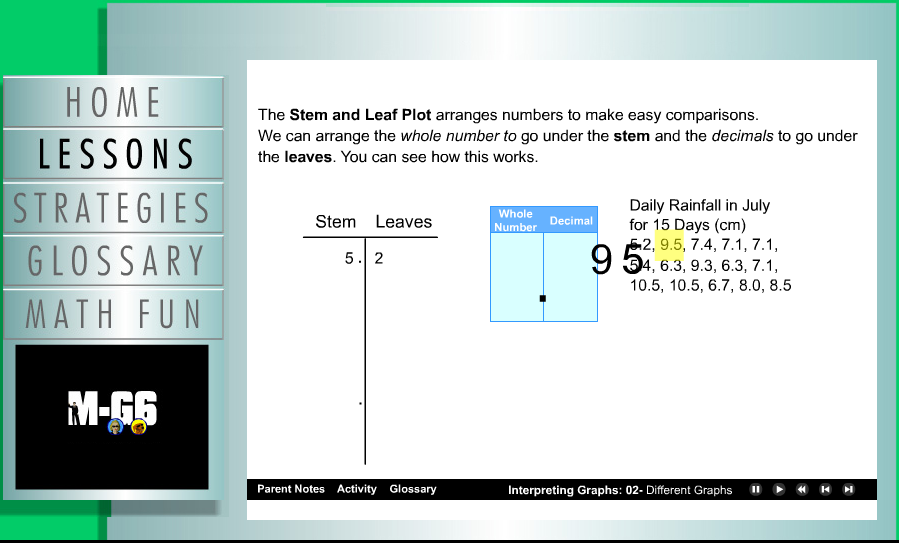
14. Spy Guys Interactive - Understanding and Interpreting Graphs.
Click Image to Enlarge
Watch the video and respond at various places Lesson 10. This video includes sections which ask students to input responses SEE MORE
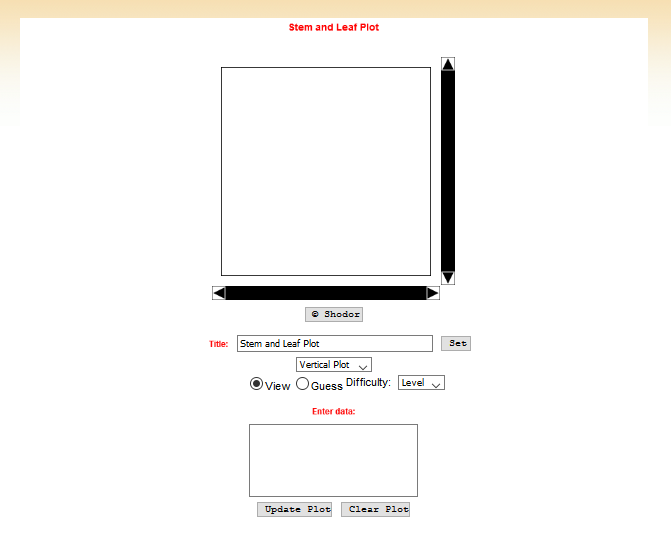
15. Stem and Leaf Plotter.
Click Image to Enlarge
Use this interactive applet to input data and create a graph. Additional related resources can be found under the learner tab. SEE MORE

Internet4classrooms is a collaborative effort by
Susan Brooks and Bill Byles.

advertisement
advertisement
Use of this Web site constitutes acceptance of our Terms of Service and Privacy Policy.