| Sign Up For Our Newsletter |
| Sign Up For Our Newsletter |
Box-and-Whisker Plots - 8.F.B.5
Links verified on 04/16/2024
1. Box and Whisker Plot Jeopardy!
Click Image to Enlarge
Instant Jeopardy Review is designed for live play with up to ten individuals or teams. Teams choose a question, then try to give the best answer. Scoring is built in for each team. SEE MORE
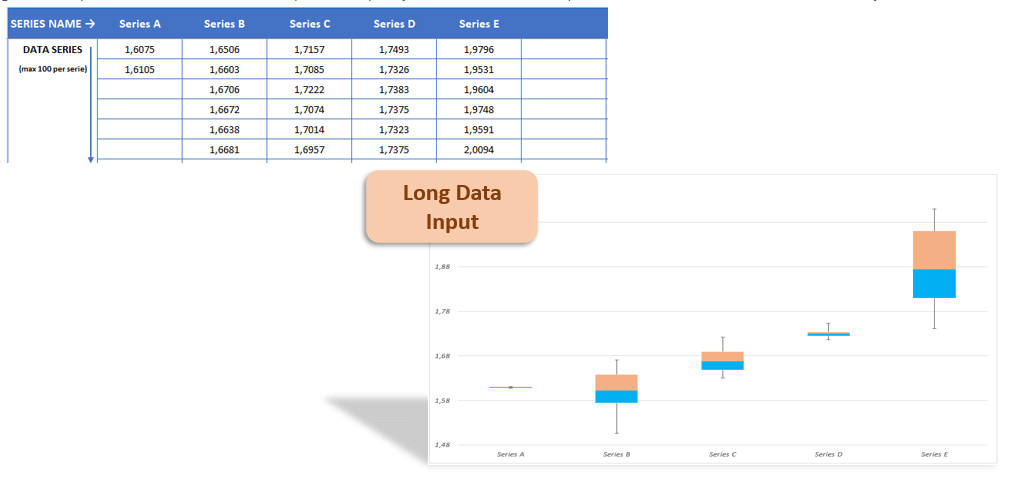
2. Box and Whisker Plot Maker.
Click Image to Enlarge
This Box and Whisker Plot helps you to compare the distribution of the data sets and show it professional visually. Free plot maker in Excel! SEE MORE
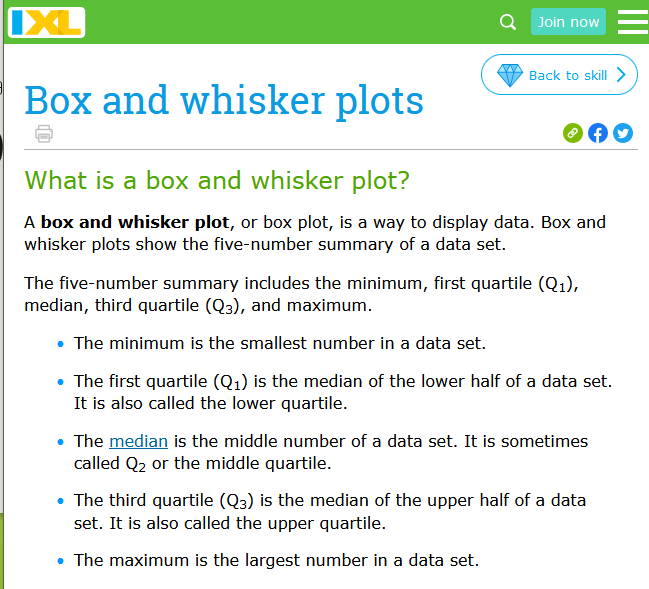
3. Box and Whisker Plots.
Click Image to Enlarge
This is a lesson on what is a box and Whisker plot with opportunities to practice what is learned. SEE MORE
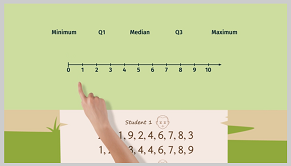
4. Box and Whisker Video.
Click Image to Enlarge
This video reviews how to set up a box and whisker plot. SEE MORE
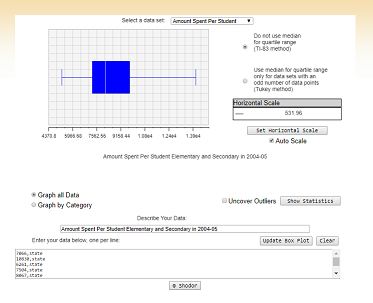
5. Box Plot.
Click Image to Enlarge
This activity from Shodor allows the user to view box plots for either built-in or user-specified data, and experiment with outliers. (Related resources available under the learner tab.) SEE MORE
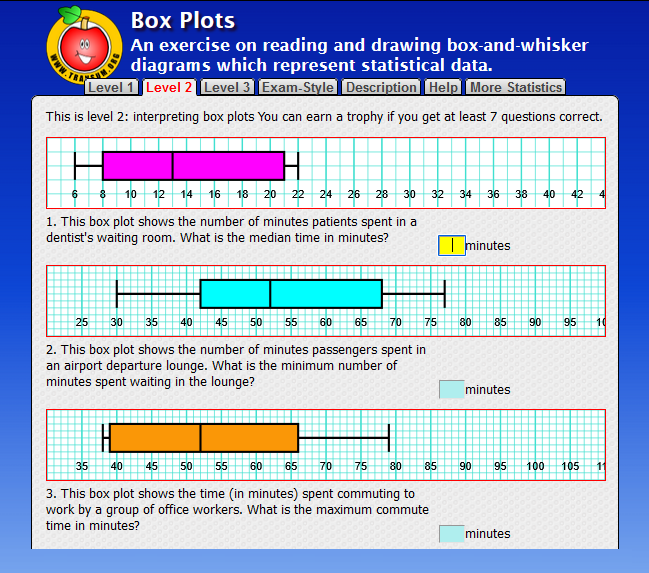
6. Box Plots.
Click Image to Enlarge
An exercise on reading and drawing box-and-whisker diagrams which represent statistical data. (Additional levels and exam available) SEE MORE
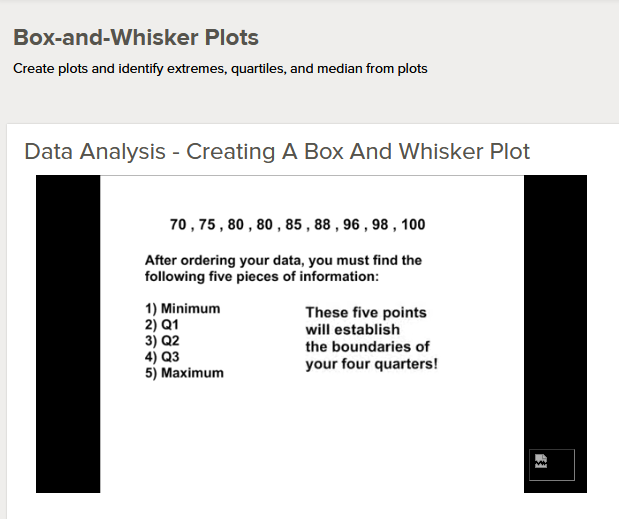
7. Box-and -Whisker Plots.
Click Image to Enlarge
This video lesson and practice problems will explain how to create a box-and-whisker plot. The students will learn how to find the right box-and-whisker plot, compare the different data sets, find the data set(s) corresponding to the box-and-whisker plot pictured, label the values in a box-and-whisker plot and then determine the interquartile range. SEE MORE
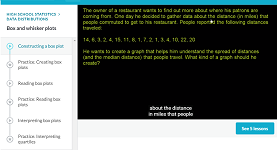
8. Construct A Box and Whisker Plot Lesson.
Click Image to Enlarge
Here's a word problem that's perfectly suited for a box and whiskers plot to help analyze data. Let's construct one together, shall we? Created by Sal Khan and Monterey Institute for Technology and Education. SEE MORE
9. Create Your Own Graph.
Click Image to Enlarge
Explanation and several good examples from Canada's National Statistical Agency. SEE MORE
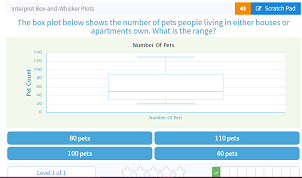
10. Interpret Box-and-Whisker Plots.
Click Image to Enlarge
Interpret the data in a box and whisker plot with multiple choice answers. SEE MORE
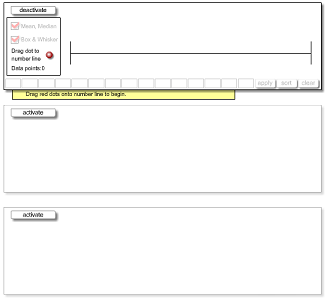
11. Mean and Median.
Click Image to Enlarge
This applet allows the user to investigate the mean, median and box-and-whisker plot for a set of data that they create. The data set may contain up to 15 integers, each with a value from 0 to 100. SEE MORE
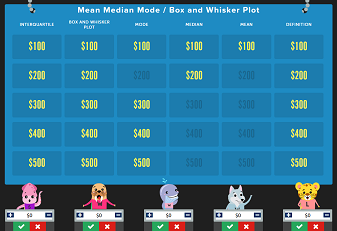
12. Mean Median Mode/Box and Whisker Plot Jeopardy.
Click Image to Enlarge
Mean Median Mode / Box and Whisker Plot. Play this jeopardy style game now! Allows up to 18 teams. SEE MORE

Internet4classrooms is a collaborative effort by
Susan Brooks and Bill Byles.

advertisement
advertisement
Use of this Web site constitutes acceptance of our Terms of Service and Privacy Policy.