| Sign Up For Our Newsletter |
| Sign Up For Our Newsletter |

Animating a Chart
By animating the elements of the graph, you can make your points more clearly. Each piece of a chart can be displayed on the screen one at a time.
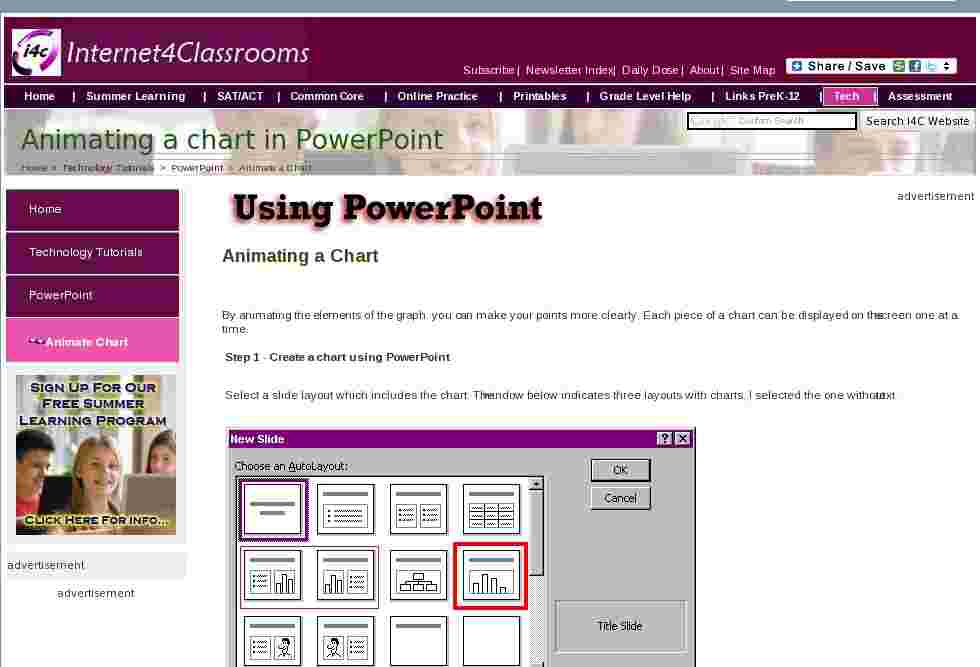
Step 1 - Create a chart using PowerPoint
Select a slide layout which includes the chart. The window below indicates three layouts with charts, I selected the one without text.
To begin entering data to create a table, double click on the chart icon.
I strongly advise that you change only a few cells at a time. Do not delete all of the data. As you enter data the chart associated with the spreadsheet will change. That way you know what changes you need to make. If you had deleted everything before starting you may not be sure where the color names and numbers should be placed to create the chart.
Enter the data collected from the M & M activity. I listed the six colors and how many of each color I found in the bag.
After all data has been entered into the spreadsheet, delete the remaining data. To do this quickly I highlighted columns B, C, and D and deleted the columns.
Closing the spreadsheet produces a chart on the slide you were working on. I made further modifications by changing the colors to match the M & M colors from my graph.
Step 2 - To animate the chart, go to the Slide Show menu and choose Custom Animation
Step 3 - Working with the Custom Animation pop-up box
- Select the Chart Effects tab
- Check the box beside Chart
- Select how you want the chart elements to be presented ( by Series was my choice)
- Choose an Entry animation
- Use restraint, don't select a sound to go with the animation. Write me , I will explain.
When you think you have what you want, select the preview button to see what your chart animation looks like. Make any changes you want to before selecting OK.
Step 4 - One final touch.
Unless you went to the Order &�Timing tab and selected automatic, you must click your mouse for each part of the chart to be displayed.
On the Order &�Timing tab select automatically and use the up or down arrows to set the number of seconds between displays.
Note: If you are a real techie, and love playing around with what PowerPoint will do, go to a page to see how to make the same thing happen by using ungrouping .

Internet4classrooms is a collaborative effort by
Susan Brooks and Bill Byles.

advertisement
advertisement
Use of this Web site constitutes acceptance of our Terms of Service and Privacy Policy.
