| Sign Up For Our Newsletter |
| Sign Up For Our Newsletter |

Using a Radar chart in Excel '07 to see the Big Picture
Charts in Excel allow you to quickly see patterns. However, sometimes it is hard to see the overall shape of the forest for the trees in your way. An Excel chart which might allow one to see the "Big Picture" more quickly is a Radar chart. To demonstrate the use of this type of chart, we will compare the average monthly temperature for three cities; a Northern hemisphere ocean moderated location, a Southern hemisphere ocean moderated location, and my home town Memphis, TN.The sources I used for the temperature information are:
http://www.weather.bm/ [Bermuda]http://www.auinfo.com/Sydney-climate.html [Sydney]
http://www.rssweather.com/climate/Tennessee/Memphis/ [Memphis]
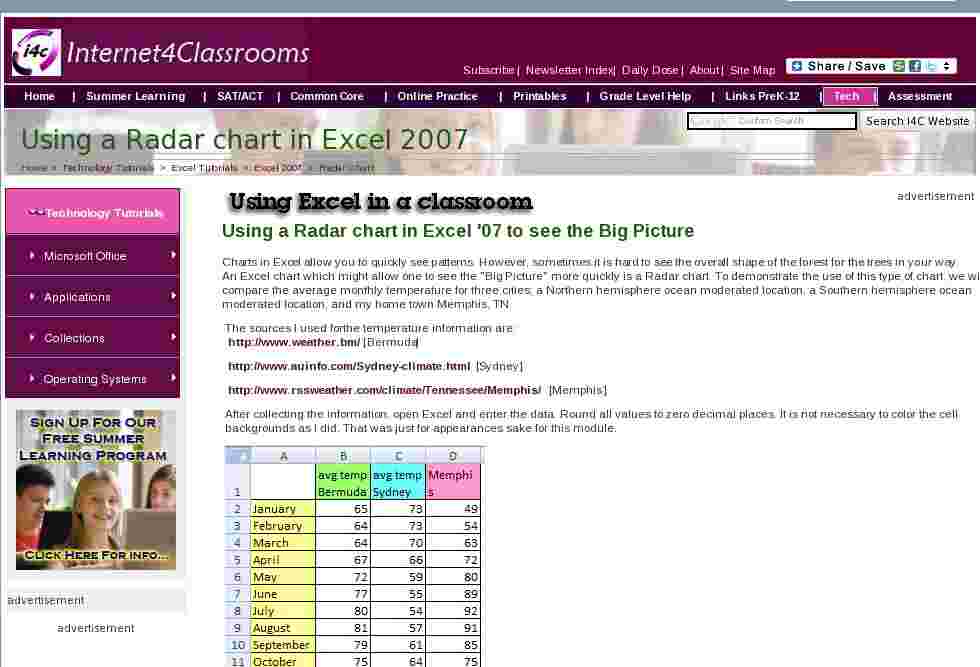
After collecting the information, open Excel and enter the data. Round all values to zero decimal places. It is not necessary to color the cell backgrounds as I did. That was just for appearances sake for this module.
With your cursor in cell A1, select the Insert tab. In the Charts area of this tab click on the Other Charts icon and slide down to the Radar area. I selected the middle of the three charts, Radar with Markers .
When the chart is created the Excel ribbon automatically displays the Chart Tools tab. To add a title or make other changes click on one of the Chart Layouts .
Other changes can be made to the Radar chart by selecting one of the Chart Styles available. To see all styles click on the More button in the bottom right part of the Chart styles section.

Forty-eight pre-designed styles are available. Live preview is not available for this change. You must click on a style to see the change.
The default location for an Excel chart is on the worksheet where the data was entered. If you wish to see the chart on a new sheet click on the New Location icon at the far right end of the Chart Tools tab and select New Sheet .
The pattern in this data set is more clearly revealed using a Radar chart
Another use of a Radar chart would be to compare the hours of daylight at various latitudes during the course of a year. The workbook used to produce this module can be downloaded.
Let me know if you have any other ideas for using this feature of Excel.

Internet4classrooms is a collaborative effort by
Susan Brooks and Bill Byles.

advertisement
advertisement
Use of this Web site constitutes acceptance of our Terms of Service and Privacy Policy.
